Gold Price Forecast: Gold To Rise On Fed Dollar Debasement

Posted on Posted in Articles

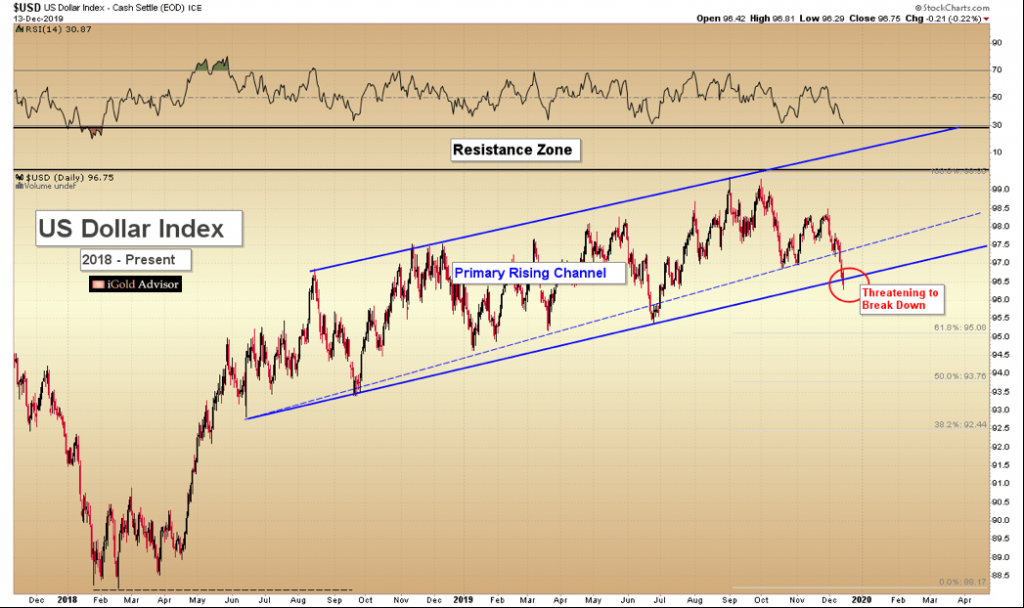
We are starting to get a stronger sense of what will be causing 2020’s advance in gold and silver: weakness in the US dollar and a concurrent inflationary spike in the entire commodity sector.

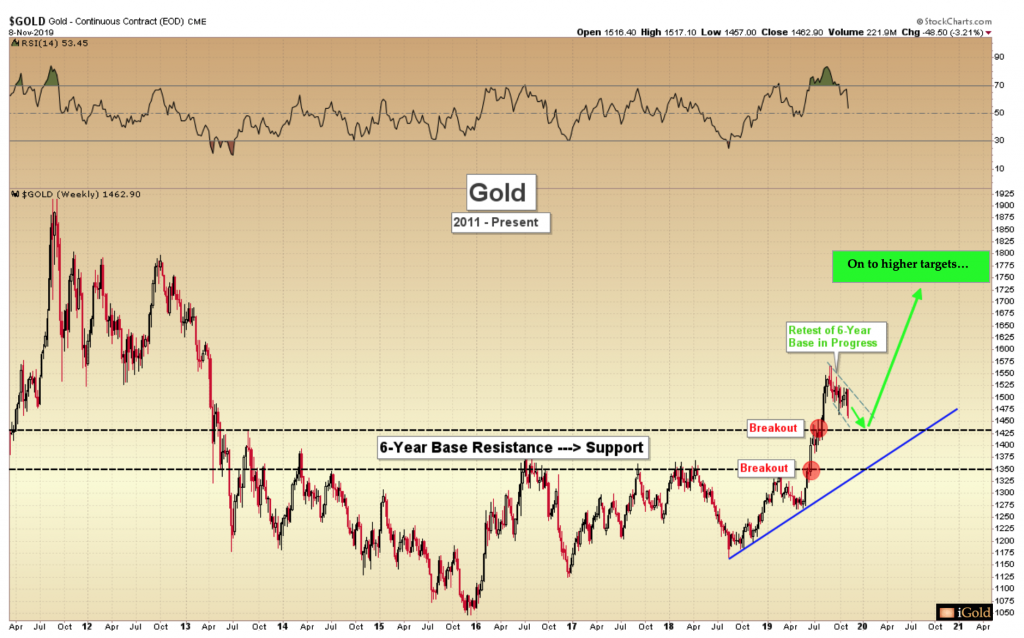
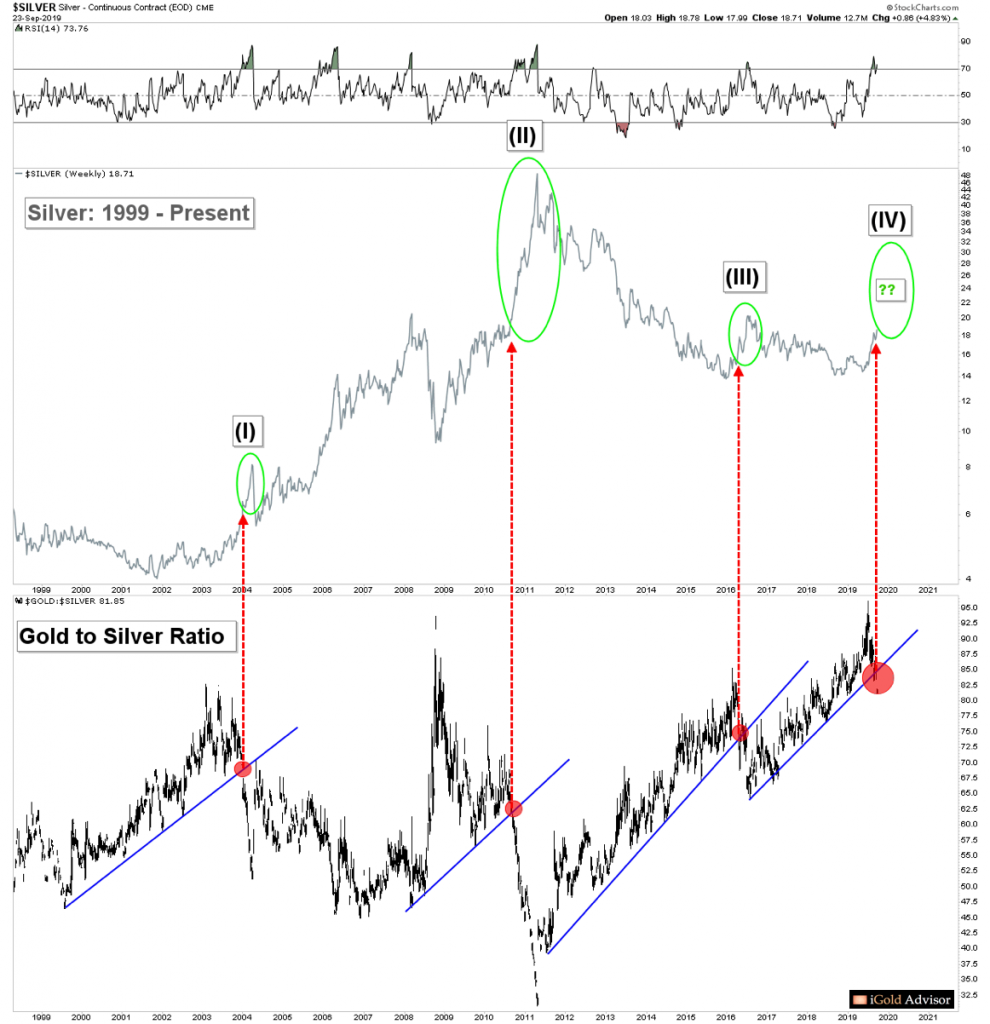
Gold and silver sometimes act on their own, independent of what is happening to the broader commodity world. However, at other points gold and silver will get pulled together with the rest of the resource sector – this is what is about to occur in the precious metals world.

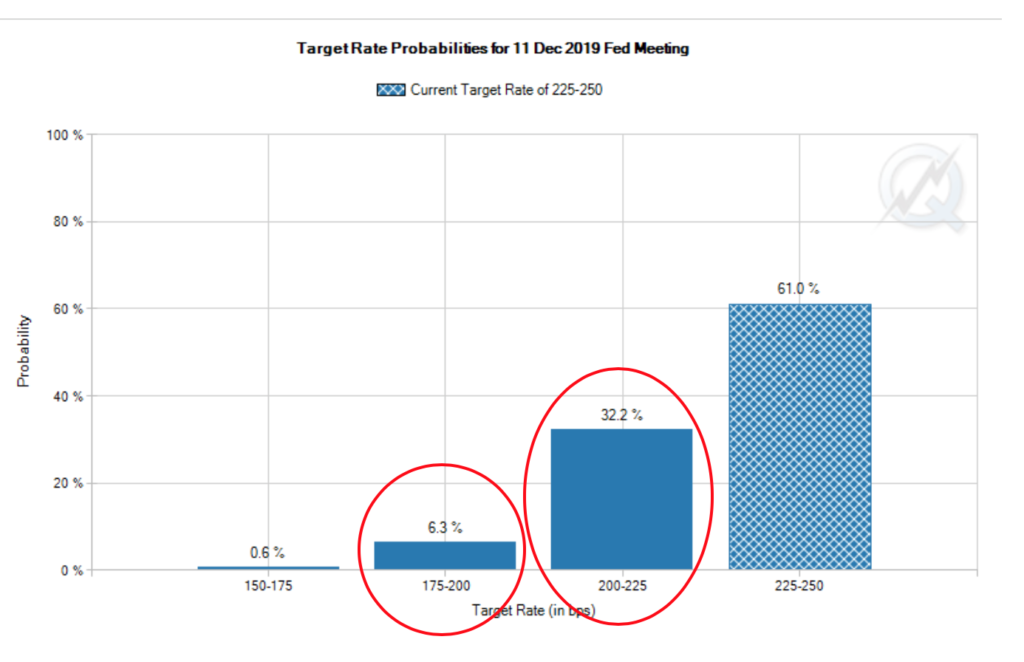
The market does not need the Fed to intervene in the repo market, nor in any market for that matter. If lending in the repo market has gotten tight, there is a reason for that: lenders are cautious due to dubious fundamentals within the wider economy. The idea that the Fed should act to supersede the independent decision-making of individual institutions involved in the repo market is one that leads to a slippery slope of moral dilemma as problems grow larger and larger.

Not only did the Fed outline a new $425 billion “liquidity” program this week, it also promised to print more money by buying short-term US Treasury bonds if financing pressures required such. Fed Chairman Jerome Powell stated explicitly:

Click here to continue reading for FREE on our partner site, Gold Eagle…

Gold Price Forecast – After Retest, Higher Targets…

Posted on Posted in Articles

Gold saw a huge sell-off last week: the precious metal was down by $49 or 3.2% to close at $1,463 as of the final trade on the New York COMEX on Friday afternoon.

During declines as we witnessed last week, it can be helpful to remember the big picture: gold broke out of a six-year basing pattern below $1,434 per ounce last August. After six years of grinding prices before then, it is unlikely that the final top is in yet after a single one-month surge above the resistance zone.

What we are witnessing now is a retest of the breakout. A retest is simply a term which describes behavior in which the market is literally asking former buyers: “Are you sure you meant to buy back then?”

Once the retest is complete, higher targets are expected:

Click here to continue reading for FREE on our partner site, Gold Eagle…

Silver Price Forecast: Rare Signal Says Surge Ahead

Posted on Posted in Articles

The precious metals are on the verge of flashing a signal that has only appeared three other times in the last twenty years. While the signal will be positive for all of the precious metals, it is silver that looks set to shine the brightest over the next several months.

Investors should carefully consider whether they have a proper allocation to the silver sector at this time.

Continue reading for FREE on our partner site, Silver Phoenix…

Silver Price Forecast: The Coming Surge Will Fail

Posted on Posted in Articles

Silver has been the laggard of the precious metals sector as of late: while gold has just broken above its 2016 high of $1,378 on the heels of trade war tensions and the possibility that the Federal Reserve may lower interest rates this year, silver has barely budged.

Year-to-date, silver is down 3.5% to $15.00 per troy ounce as of the end of the week. Meanwhile, gold is higher by 9.3% or $119 for the year, to $1,400.

What are we to make of this continued underperformance by silver? Is it a sign that the move in gold is suspect and should not be trusted? Or is it a sign that we are simply in the early stages of a new bull market?

Let us examine the present period in silver prices, the modern history of the gold to silver ratio, and what this might mean for silver investors going forward.

Click here to continue reading the article for FREE on our partner site, Silver Phoenix…

Gold Price Forecast: Gold Lower Even As Fed Loses Credibility

Posted on Posted in Articles

The Federal Reserve is on the verge of a credibility problem: the market does not believe the central bank at its word.

Let us rewind: at the January 30, 2019 Fed meeting, the central bank wavered on its 2015 – 2018 interest rate hike campaign and began to hint that it would at least pause for the intermediate-term on further increases. This was a significant departure from the 2015 – 2018 period, which saw rates rise from zero to the present 2.25% – 2.50% in three years.

Click here to continue reading the article for FREE on our partner site, Gold Eagle…

Gold Price Forecast — a Warning from the Japanese Yen

Posted on Posted in Articles

The gold price has been strong recently, having risen over $180 from the August 2018 low of $1,167 to the peak above $1,347 as of last week.

There have been solid fundamental reasons for gold’s run: primarily, the Federal Reserve last month hinted that it may not continue raising interest rates, as it had been assuring it would over the past three years. Such in turn has been considered a sign that the Fed may in fact reverse course and begin cutting rates later this year, which is generally considered negative for the value of the dollar and positive for precious metals.

However, are these fundamentals enough to keep bullion’s run alive? Will this market narrative continue going forward?

A Rare Warning Signal

Despite the recent performance, one of our proprietary technical indicators is flashing a major warning signal for those who follow the language of the charts. Specifically, gold is showing a sell signal witnessed only four times over the past eight years. This warning signal coincided exactly with the absolute peak in gold at $1,923 in September, 2011. This same signal appeared again in January 2013, immediately before gold fell $500 from $1,680 down to $1,180 over just six months.

So reliable has this signal been, that it has never occurred without gold falling at least $130 over the subsequent six months.

Click here to continue reading the article for FREE on our partner site, Gold Eagle…

Gold Prices Face the Wall

Posted on Posted in Articles

Walls have been in the news a lot lately. Walls which may be built, walls which may not be built.

Yet for all the talk of walls these days, there is one wall that precious metals investors should be focusing on foremost. And no, it has nothing to do with the southern US border.

Instead, the barrier we are referring to is the wall of sellers who will be showing up in the precious metals as gold approaches $1,300 per ounce.

What are we referring to, specifically?

Let us examine the visible data.

Click HERE to continue reading for free on our partner site, Gold Eagle…

Silver Update: Recovery… then New Low Below $14

Posted on Posted in Articles

Silver has enjoyed a modest recovery over the past six weeks, rising from a low of $14.00 in September to $14.70 as this article is being written. What is in store for this dual precious and industrial metal as 2018 closes out? Is there more upside to come or will the downward trend of lower prices from last summer re-exert itself?

Over the next several weeks, we see higher prices in store for silver. However, once this rally concludes, another down-leg should begin for gold’s cousin. Investors should monitor these trends closely as they develop and be prepared for a better buying opportunity early next year.

Let us turn to the visible data.

Click HERE to continue reading the article for free on our partner site, Silver Phoenix…

The Gold COT Myth Debunked – Speculators Are Usually Right

Posted on Posted in Articles

There is a fallacy now spreading throughout the precious metals world, and gold investors who believe it to be true will be making a costly mistake when attempting to navigate the volatility in this market over the next several years.

What is the fallacy we are referring to?

Gold’s Commitment of Traders (COT) Report, and the claim of the bullish setup that is being purported on account of the net long position by commercial traders and net short position by large speculators.

Indeed, not a week goes by that we do not see articles published claiming that this myth is in fact true. We will not name any names here in this article, because the fallacy is nearly universally believed, and a quick Google search for “Gold COT report” will reveal dozens of such misleading articles. The time has come to set the record straight.

Click HERE to continue reading the article for free on our partner site, Gold Eagle…


Gold Price Forecast: Miners Expecting Lower Gold

Posted on Posted in Articles

Gold has had a rough several months. The precious metal is down some $170 from its peak in April near $1,370, closing today just below $1,200 on the New York COMEX futures market. As we indicated in our last article, gold has failed to maintain the structure that would be indicative of a bull market in progress. That said, no market moves in a straight line, and a reversal will be in store at some point. What are some price projections as gold heads lower over the coming months where we may look to see support emerge?

There are a number of ways to estimate price targets for gold. Established support and resistance zones, Fibonacci retracements, and trend channels are just a few. However, for this article let us focus on a powerful way to gauge the potential for future gold prices – and that is: what the mining complex is expecting.

Miners Gold Price Expectations

Gold mining profits are leveraged to the underlying metal price. When the price of gold rises by 1%, gold miner profits typically rise by 2% – 3%, as the underlying costs to mine the metal remain relatively fixed. The same leverage works to the downside of course. The bottom line is that investors in the gold mining sector should have a solid idea of what the price of gold itself is going to do, as the price is a critical determinant of operational success.

That said, let us examine the figures that the gold miners are now pricing in for their own product. This can be a valuable form of analysis to use any time one is preparing to make a sizeable gold purchase.

Below we show the GDX large-cap gold miners fund on top, with the price of gold immediately below it. The GDX contains an average of approximately 50 different mining operations. Let us examine the relative valuations of the two since late-2015:

Click here to continue reading for FREE on our partner site, Gold Eagle…

Gold: Recovery Pattern Has Failed

Posted on Posted in Articles

Gold’s bottoming attempt following the 2015 low of $1,045 per ounce has failed to maintain a price structure indicative of a rising trend. Consequently, the odds have now shifted significantly that precious metals will not be in a bull market for the foreseeable future. This does not mean that the price of gold is going to crash, nor that an investment in the precious metals sector may not be wise given one’s unique situation. However, with the recent trend failure the highest-probability is that the 2016 peak of $1,378 per ounce will not be overcome for gold for at least the next several years.

Let us examine the current price trajectory and some ramifications.

Click here to continue reading for FREE on our partner site, Gold Eagle…


Gold — Short Term Recovery, Long-Term Caution

Posted on Posted in Articles

The short-term forecast for gold is clear: the metal is set to move higher. Gold has just put in an intermediate low at $1,238 per ounce as of July 3, 2018. Several leading indicators point to an imminent recovery in prices over the next 1-3 months.

However, the longer-term picture for the precious metal is mixed: gold must overcome its 2016 high at $1,378 within the next six months to avoid a significantly bearish outcome that could result in a multi-year decline following such a failure.

The time to closely monitor gold’s price action for one of these scenarios is now.


Click here to continue reading for FREE on our partner site, Gold Eagle…

Gold Price Forecast: Recovery Pattern Must Be Maintained

Posted on Posted in Articles

Gold is in a primary recovery pattern as it attempts to break above its 2016 peak of $1,378 per ounce. This recovery pattern appears over and over again throughout history – the success or failure of gold to maintain the structure of this pattern will pave the way for either a massive multi-year advance higher in the sector, or a grinding decline to last for the majority of the next decade.

We will have the answer to the question of which outcome to expect within the next 12-18 months.

It will behoove precious metals investors to pay close attention to the technical action and to tune out misleading rhetoric coming from both perma-bulls and perma-bears of gold and the precious metals sector.

Click here to continue reading for FREE on our partner site, Gold Eagle…

Gold Miners – Reversion Higher to Mean

Posted on Posted in Articles

Gold miners, the companies which extract the element from the Earth which has served as the backbone of the global economic system since the dawn of civilization, remain historically undervalued across two key metrics that are used to value the sector. Opportunity for profit exists for those with patience for the sector to revert to the mean.

First, gold companies are undervalued versus the broader US economy: a ratio of gold mining versus the S&P500 index is at its lowest valuation of all time. Secondly and perhaps more interestingly, gold miners remain undervalued relative to the price of the actual metal they produce: gold itself.

As contrarians, these are statistics we should pay attention to. Let us examine the charts.

Click here to continue reading for FREE on our partner site, Gold Eagle…

Gold to Silver Ratio – Lessons from History

Posted on Posted in Articles

Silver is acting weaker than it should be this juncture, just over two years after an important bottom in the precious metals complex formed in late 2015.

From the December 2015 lows in both precious metals at $13.65 per ounce for silver and $1,045 for gold, while both have risen, silver prices have underperformed gold. Since the bottom, silver is up 19.8% to close at $16.36 this week, while gold is up 27.8% to close at $1,336 over the same timeframe. Silver is clearly the laggard of the historic monetary metals amidst the present cycle.

What are we to make of this underperformance in silver? Is there still a possibility for silver to match gold’s performance? Or is this a warning sign that the advances in the precious metals since 2015 are suspect?

The best way to view the relationship between the two metals is through the gold to silver ratio. The ratio tells us how many ounces of silver are needed to purchase one ounce of gold. As of the end of the week, the ratio stood at 81.6.

Click here to continue reading for FREE on our partner site, Silver Phoenix…

What Affects the Gold Price — A Historical Perspective

Posted on Posted in Articles

What Affects the Price of Gold?

A Historical Perspective

Gold has been a part of the human story since the dawn of civilization. One part store of wealth, one part ornament, and one part modern technology, gold stands at the crossroads of multiple financial, religious, and industrial trends.

What actually drives gold prices? Is it fear of currency devaluation or stock market crashes? Is it war? Or is it jewelry and electronics fabrication?

The answer is many-fold. In this article, we will highlight the complex and inter-related drivers for gold prices worldwide so that investors may have a fuller understanding of the totality of the precious metals market.


Gold Supply and Demand

Fundamentally, the answer to what affects the price of gold is the same as for every other market: supply and demand.

Yet the supply and demand balance for gold, a market which dates back to the dawn of record-keeping itself, is itself largely driven by factors which are deeply ingrained in the human psyche.

Two extreme emotions – greed and fear – comprise the spectrum through which the majority of participants in the gold market make their buy and sell decisions.

In this article we will examine the many ways in which greed and fear play out, over and over again, in the most ancient of financial markets which is yet seeing new life today.


Gold Supply

Before we examine the actual numbers, let us consider one important preliminary supply factor for gold: this is the only element in which all of the supply ever mined in the history of the world still exists above ground. Gold never rusts, tarnishes, corrodes, or burns. Except for small amounts which may have been lost in shipwrecks at the bottom of the ocean or disposed of in landfills, all of the gold that has ever been brought to surface of the planet still exists in one form or another (and arguably, those two sub-components are retrievable as well).

Click here to continue reading for FREE on our partner site, Gold Eagle…


Gold Forecast: US Dollar Recovery And Its Impact On Gold Prices

Posted on Posted in Articles

We are now preparing for what should be the final retracement in the gold price before 2016 highs are exceeded for good. The degree to which this retracement gives back recent gains is open to some variability, but the highest probability assessment is that gold will find support over the next 1-3 months within the $1,295 – $1,305 range. The subsequent advance should take prices above the 2016 peak at $1,378 en route to $1,400+ later this year and $1,500 by early 2019.

We expect a correction in gold will now unfold due to the important support zone that is being tested for the US dollar, which should lead to a multi-month rally for the US currency. As a backdrop, investors should recall that typically (but not always) the gold price and the US dollar move in opposite directions. We can observe this inverse relationship with an examination of the two asset classes over recent months:

Click HERE to continue reading the full article for free on our partner site, Gold Eagle…


Updated Gold Forecast: 2016 Peak To Be Exceeded This Year

Posted on Posted in Articles

Having observed the strength of gold’s surge following the successful retest of its long-term 2011 – 2017 downtrend three weeks ago, the theme for gold now becomes one of working to overcome 2016 highs over the intermediate term. Our focus must therefore change from one of concern that the retest might fail, which implies a more conservative posture, to the health of the long-term basing pattern that is now rounding upward in terminal fashion. We believe new highs for the move that began in 2015 are in store for this year. Retracements will still occur and they will be scary at times, but in the establishment of a new rising trend we should look to be aggressive amidst dips and not fearful on corrections.

Click HERE to continue reading for free on our partner site, Gold Eagle…


2018 Gold Price Forecast – A Major Bottom is Forming

Posted on Posted in Articles

Gold is now completing a pattern which repeats over and over again throughout history. The pattern suggests that a critical low is forming, and that the price of gold is set to begin a new primary advancing trend in 2018.

Note that we are not anticipating skyrocketing prices – such is the realm of headline hyperbole. Further, at this firm we have not been bullish on precious metals from 2011 through 2015. Regular readers will know that no bullish articles were published by this firm during that period: we were waiting for the proper technical signals to align which showed that the declines after 2011 had concluded.

Those signals are now visible. A new advancing trend in gold will set the stage for a markedly different backdrop which will impact short-term traders, investors, and mining companies alike. We must pay attention to these signals as they emerge now and before they are widely-known to avoid chasing markets higher – a strategy which usually results in severe losses.

Click HERE to continue reading for free on our partner site, Gold Eagle…


US Dollar, Gold, and Euro Update

Posted on Posted in Articles

The US dollar is on the edge of a decline that may take many by surprise throughout 2018 and 2019. Conversely, gold, the euro and many non-dollar assets stand to benefit. Certain segments of the US stock market may hold up in a falling dollar environment, especially those which can raise prices to compensate. Yet to use the skydiving analogy: the time to buy a parachute for protection is before the falling begins. As usual, we will focus here primarily on technical analysis, and endeavor to avoid the fundamental-only rhetoric that is so often misleading at exactly the most crucial turning points.

Click HERE to continue reading for free on our partner site, Gold Eagle…

Gold Price Forecast – First Breakout Signal Since 2008

Posted on Posted in Articles

As President Trump prepares to nominate a new chair for the Federal Reserve this week, gold prices remain in a range bound consolidation. Not only has this grinding pattern been ongoing for the last several weeks, but when we examine the price chart for the last five years, we see that gold has essentially been flat as a net sum dating back to mid-2013. And indeed, to the mainstream investor who is primarily involved in a stock market now at all-time highs, gold appears of little interest at the present moment:

Click here to continue reading for FREE on our partner site, Gold Eagle…

Watch the Gold / Yen Correlation

Posted on Posted in Articles

Both gold and Japanese yen have acted as the same asset class for practical purposes since 2011. However, early signals show gold beginning to outpace yen. Investors should not underestimate the impact that a more significant breakdown in this ratio will have on gold prices. We expect a major gold advance to coincide with a break of the lower boundary of the correlation.

Click here to continue reading for FREE on our partner site, Gold Eagle…

Gold Prices: Record-Breaking Volume

Posted on Posted in Articles

It is often said that in market analysis: “volume precedes price movement.”

Gold has just posted its highest quarterly volume of all-time for futures trading history, for the quarter ended September 30. The closing data shows that for the period, over 17.5 million contracts traded hands. This eclipsed the previous record volume by a whopping 3.5 million contracts. What’s more, the new record surpasses the number of contracts that were traded during the quarter in which gold made its all-time price high of $1,923 per ounce, which came in Q3 of 2011.

Something is happening here in the gold market, for those who would pay attention to the hints now presenting themselves.

Click here to continue reading for FREE on our partner site, Gold Eagle…