Gold Prices: Record-Breaking Volume
It is often said that in market analysis: “volume precedes price movement.”
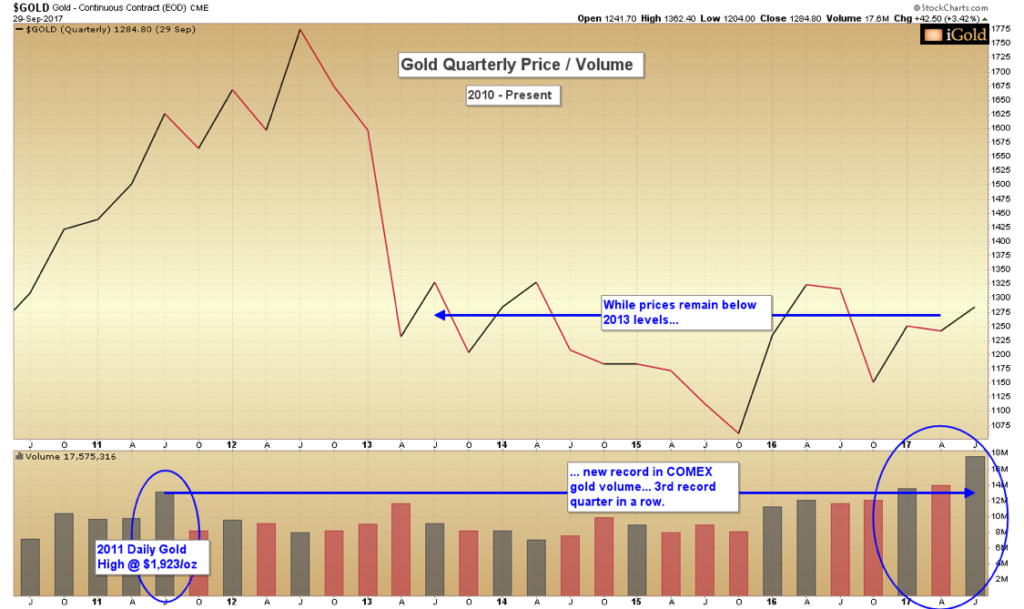
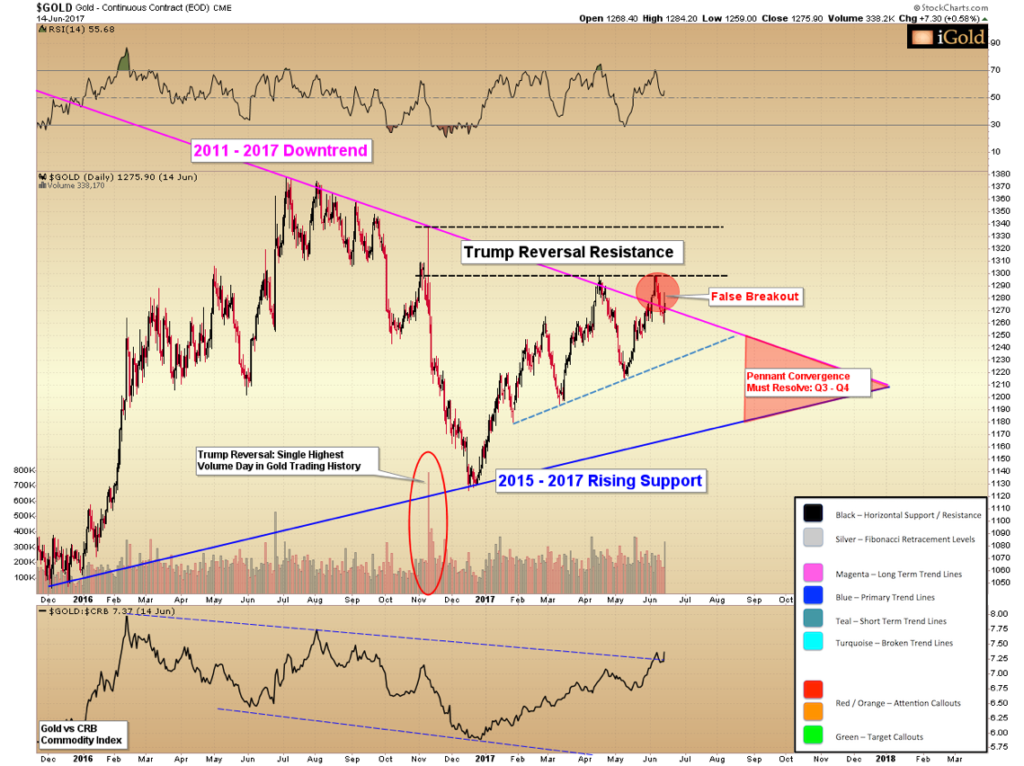
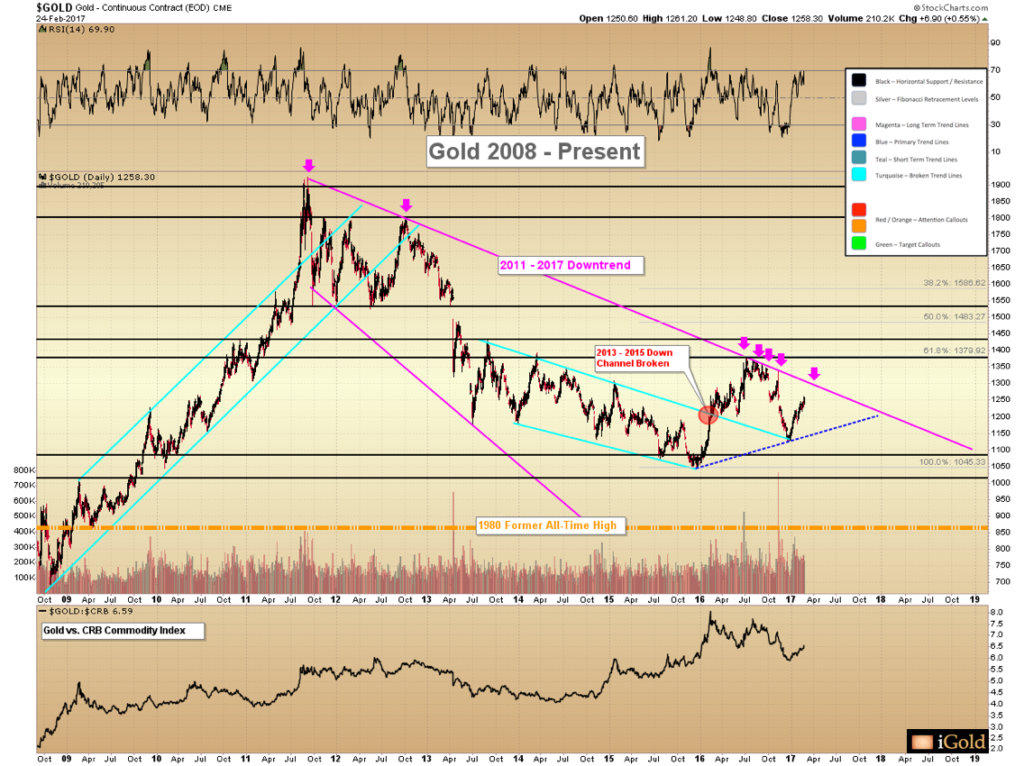
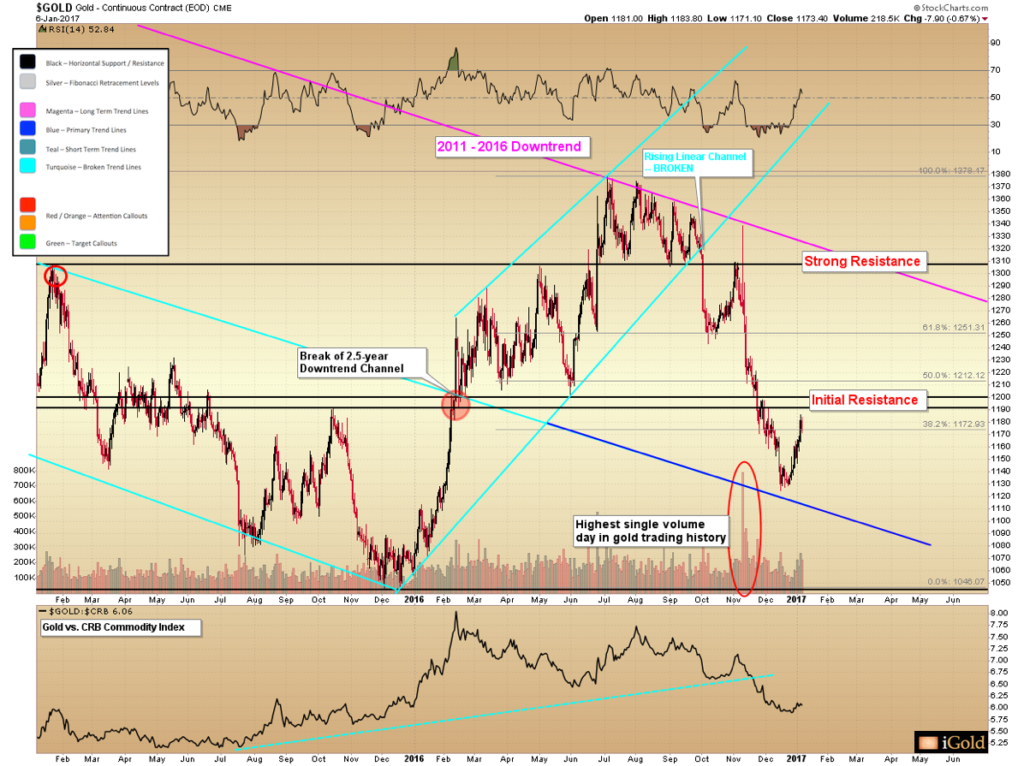
Gold has just posted its highest quarterly volume of all-time for futures trading history, for the quarter ended September 30. The closing data shows that for the period, over 17.5 million contracts traded hands. This eclipsed the previous record volume by a whopping 3.5 million contracts. What’s more, the new record surpasses the number of contracts that were traded during the quarter in which gold made its all-time price high of $1,923 per ounce, which came in Q3 of 2011.
Something is happening here in the gold market, for those who would pay attention to the hints now presenting themselves.
Click here to continue reading for FREE on our partner site, Gold Eagle…