Silver is acting weaker than it should be this juncture, just over two years after an important bottom in the precious metals complex formed in late 2015.
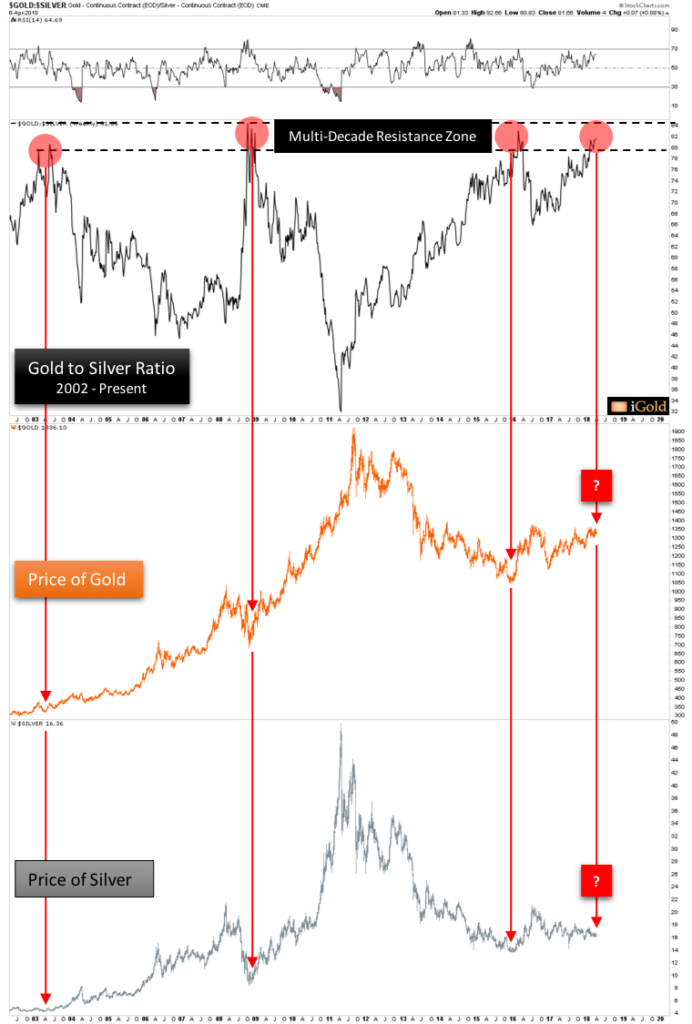
From the December 2015 lows in both precious metals at $13.65 per ounce for silver and $1,045 for gold, while both have risen, silver prices have underperformed gold. Since the bottom, silver is up 19.8% to close at $16.36 this week, while gold is up 27.8% to close at $1,336 over the same timeframe. Silver is clearly the laggard of the historic monetary metals amidst the present cycle.
What are we to make of this underperformance in silver? Is there still a possibility for silver to match gold’s performance? Or is this a warning sign that the advances in the precious metals since 2015 are suspect?
The best way to view the relationship between the two metals is through the gold to silver ratio. The ratio tells us how many ounces of silver are needed to purchase one ounce of gold. As of the end of the week, the ratio stood at 81.6.
Click here to continue reading for FREE on our partner site, Silver Phoenix…