The Golden Mean

Posted on Posted in Articles

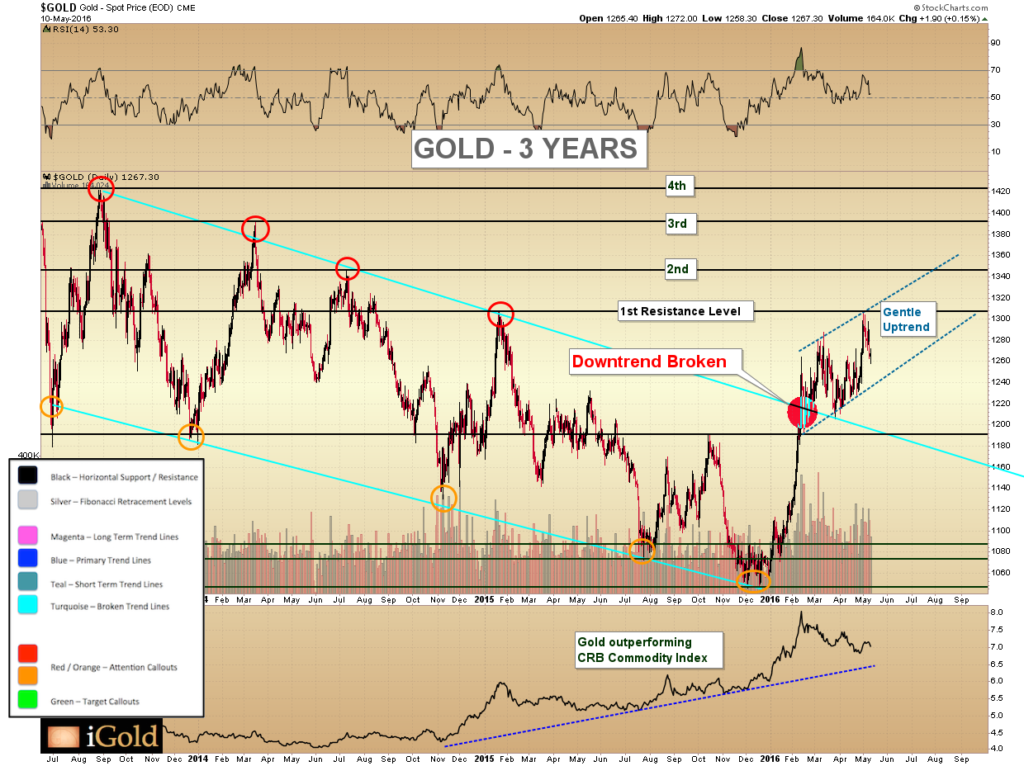
Gold continues to show underlying strength despite volatility that is leaving many investors sitting on the sidelines.

Bears are frustrated that the predicted collapse in the precious metal has not yet materialized.

Bulls are expecting a skyrocket higher any day.

Yet a third possibility exists, and there is still time to take a middle road in one’s perceptions. Ironically, such a moderate view might just end up being the most profitable in the long run.

Indeed, the philosophy of Aristotle’s aptly-titled “Golden Mean” itself encourages us to consider the middle path, and so we begin with an examination of the gentle uptrend currently in place in the gold market.

Continue reading the full article for free on our partner site Gold Eagle…
A_Gold3Y

Gold & Silver: Bull Markets Are Just Beginning

Posted on Posted in Articles

Gold is up nearly 21% from its December 2015 lows. Moreover, silver has added an impressive 28% to its price during the same timeframe. Most notably, the HUI gold and silver mining index is up over 100% during this period.

Despite the strong performance we have seen from the precious metals complex thus far in only the first few months of 2016, many fear that the move is already nearing an end. Readers should be aware that the potential for both gold, silver, and strong mining equities is much greater than the moves seen thus far. Indeed, a review of the metals and several valuation metrics over a longer time frame can provide us with clues as to what we should expect through the later part of this decade.

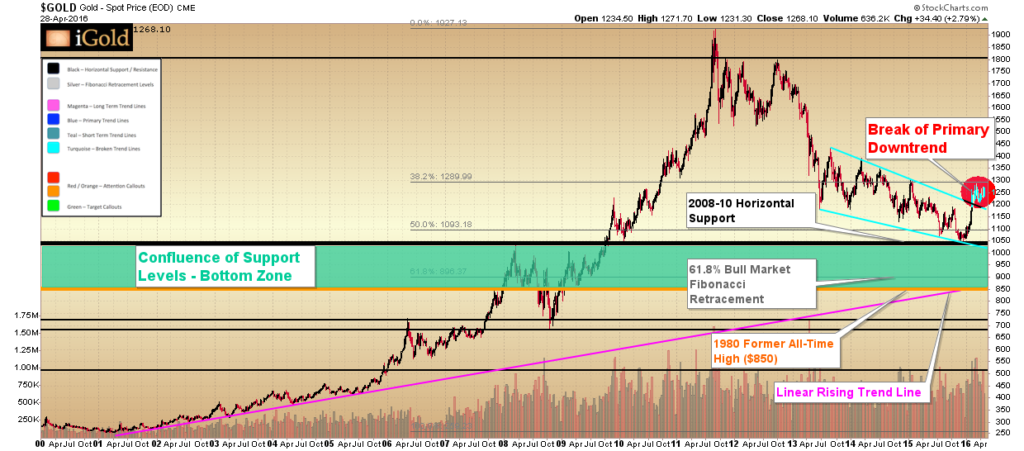
Below we review the long-term perspective for gold since the year 2000. Gold bottomed in 2001 after a nearly 20-year bear market following the peak in 1980 at $850/oz. The return advance to again challenge the $850 level took eight years, although it was not until the following year (2009) that prices decisively broke through this level for good.

Gold then advanced for two years above the former all-time high, hitting $1,917/oz in 2011, before falling back some 45% over the course of nearly five years through the end of 2015.

Markets that consolidate for 29 years (1980 – 2009) below an important peak level ($850) do not finish their subsequent advances in only two years. What was seen from 2009-2011 was simply the initial surge higher from the multi-decade 1980 – 2009 consolidation. The retreat since 2011 is thus a correction within what will be a more significant move higher both in time and in price above the former 1980 peak.

Continue reading the full article for free on our partner site Gold Eagle…

aGold16Y


Silver Update and Analysis on Recent Price Fixing

Posted on Posted in Articles

News out of Reuters on Wednesday has caused quite a stir in the precious metals investment world as a manipulative silver-fixing scheme headed by large multinational banks was revealed. Consequently,  many are wondering what the long-term ramifications of the story will be. To bring readers up to speed, we quote briefly below:

Deutsche Bank to Settle US Silver Price-Fixing Litigation

Deutsche Bank AG has agreed to settle U.S. litigation over allegations it illegally conspired with Bank of Nova Scotia and HSBC Holdings Plc to fix silver prices at the expense of investors, a court filing on Wednesday showed.

Terms were not disclosed, but the accord will include a monetary payment by the German bank, a letter filed in Manhattan federal court by lawyers for the investors said.

Continue reading the full article for free on our partner site Silver Phoenix……


bSilverBottom

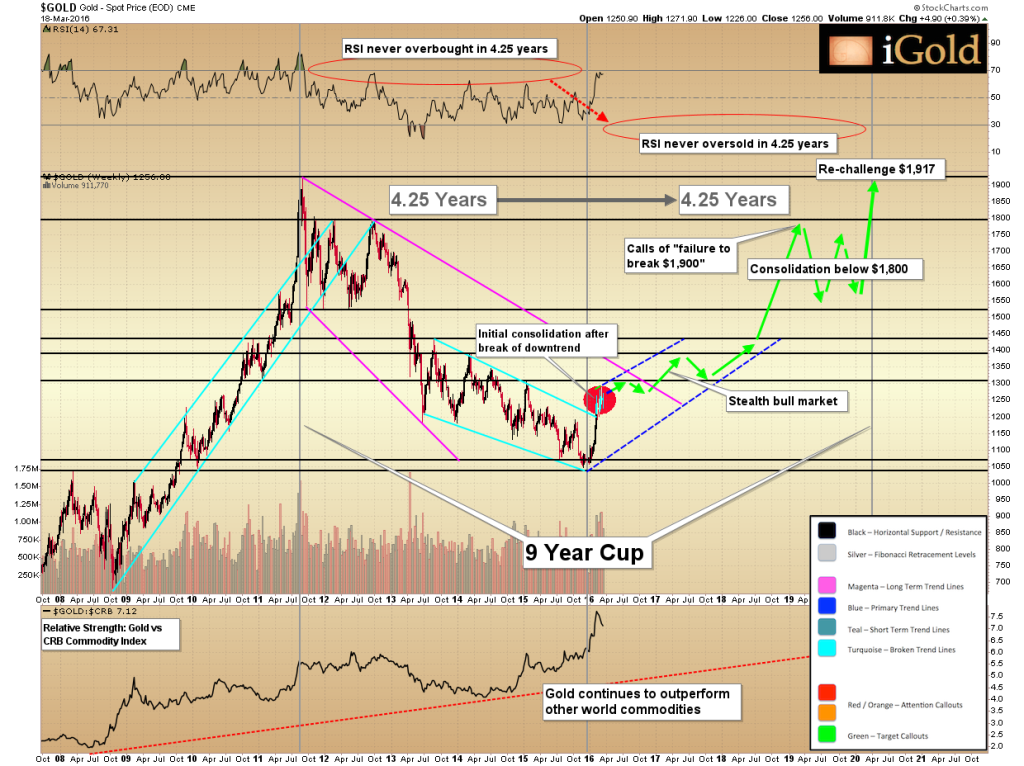
Gold 2021 Forecast: Stealth Bull Market

Posted on Posted in Articles

When it comes to forecasting gold prices, there seem to be two main types of conclusions being offered by analysts these days:

1) Gold made a long-term top in 2011, is still in a bear market…and will fall to below $700 per ounce.

2) Gold is going to skyrocket this year and see $5,000 or more by 2020.

At our firm, we fall into neither extreme. And while our type of analysis may not catch as many quick headlines, we are going to cover in detail the trajectory we believe gold prices are setting up for a distinct third possibility to the aforementioned hypotheses.

3) Gold prices will climb slowly, steadily and stealthily for the next 4.25 years without a significant pullback, re-challenging $1,900 by 2021.

Continue reading the full article for free on our partner site Gold Eagle…


c_Gold9YCup

Trade of the Decade – an Update on the Gold & Silver Mining Sector

Posted on Posted in Articles

aaron030116-2

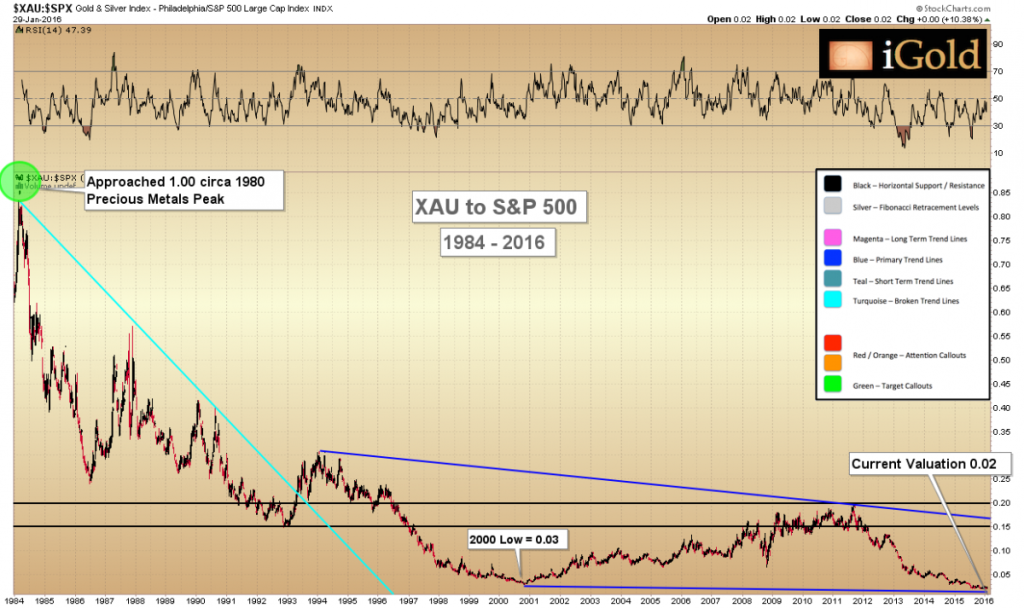
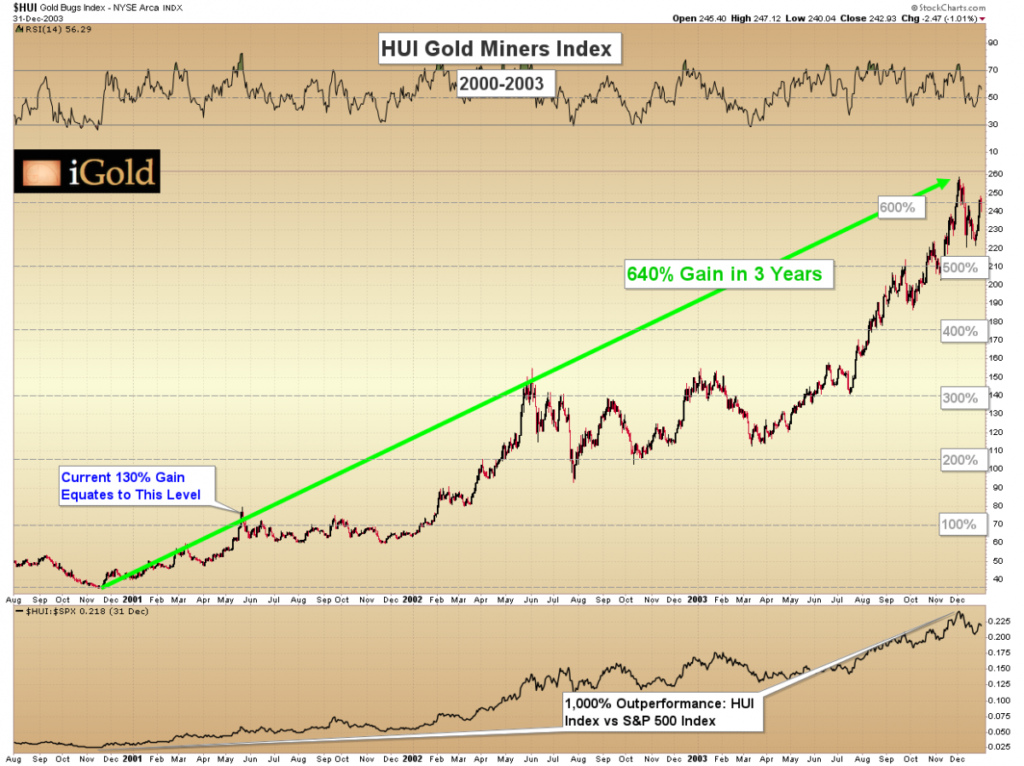
Four weeks ago we alerted readers that the XAU (gold & silver miner) to S&P 500 (US stock market) ratio, standing at 0.02, was the lowest it had ever been in modern history, with data dating back through the 1970’s. In our view, the valuation had become too extreme, and as ratios between real asset classes cannot go to zero, it was time to start looking to position for a reversion to historic norms. Additionally, our technical analysis revealed a pending break of a multi-year primary downtrend channel, as shown by the royal blue color above.

Updating our chart below we can see that the breakout in the mining sector has materialized, as the ratio has broken through the multi-year downtrend and fully cleared the 6-month resistance level at 0.029. This break higher has closed the month at 0.033, a full 65% higher in four weeks. Such would represent an annualized gain of 780%!

Continue reading the full article for free on our partner site Gold Eagle…

Gold Price And Silver Price Forecast – Bullish Consolidations

Posted on Posted in Articles

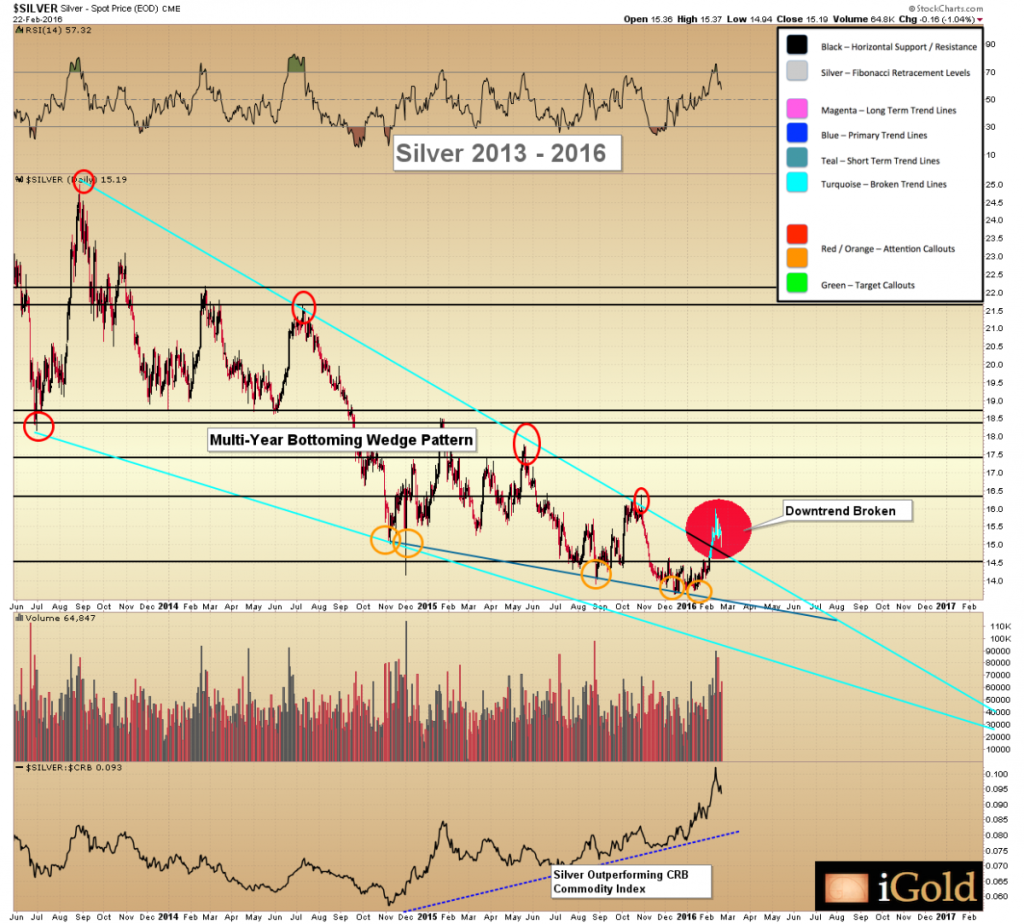
The price action for both gold and silver continues to show bullish implications for the establishment of the long-term lows we have been watching for the last several months. What we are seeing now are bullish consolidation patterns, which are very healthy for markets that have had recent strong rises. We are watching several critical support areas for these consolidations, the holding of which would set the precious metals up to begin a trending move to the upside through the later part of this year and into 2017.

aaron022316-2

Continue reading the full article for free on our partner site Gold Eagle…
Gold Looks to Confirm Long-Term Bottom

Posted on Posted in Articles

b_2Y

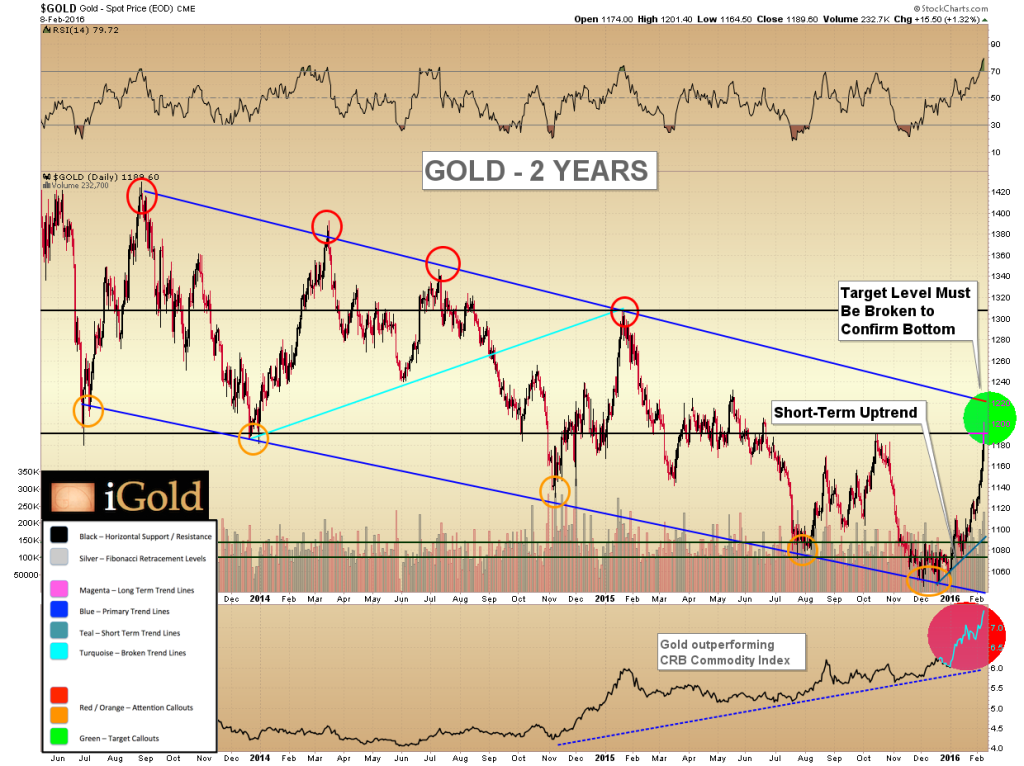
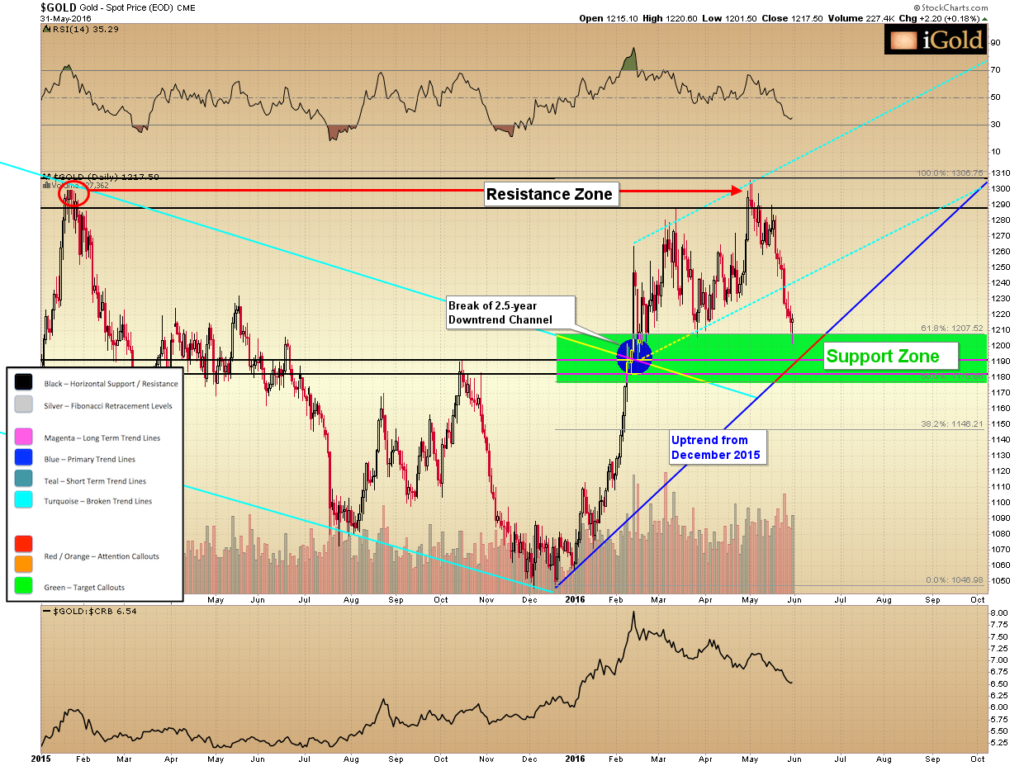
The precious metals are at critical junctures that will mark the final lows for the bear market since 2011. The surge in gold during the New Year has been impressive, with prices rising from $1,045 per ounce to hit $1,200 as this article goes to press, a gain of 15%. Has the final low been put into place?

Gold’s Key Resistance Level

We back our charts out to a 15-year timeframe to view the current action in proper context. Below we can see the rise in gold from 2001 through the peak in 2011, followed by the current bear market. Since early 2013, the downward moves have been defined primarily by a clear series of waves contained within a linear downtrend channel as shown in blue.


Continue reading the full article for free on our partner site Gold Eagle…
The Trade of the Decade

Posted on Posted in Articles

Our trade of the decade is to go long only the highest quality gold and silver mining companies, and to short the broad S&P 500 Index. By several important valuation metrics, these indices are at historic extremes. When focusing on recent patterns, we are seeing early warning indicators that the trends in the stock market and the gold sector are soon to change, if they have not done so already.

Continue reading the full article for free on our partner site Gold Eagle…
vermeulen013116-1

Stock Market Breaks Long-Term Uptrend

Posted on Posted in Articles

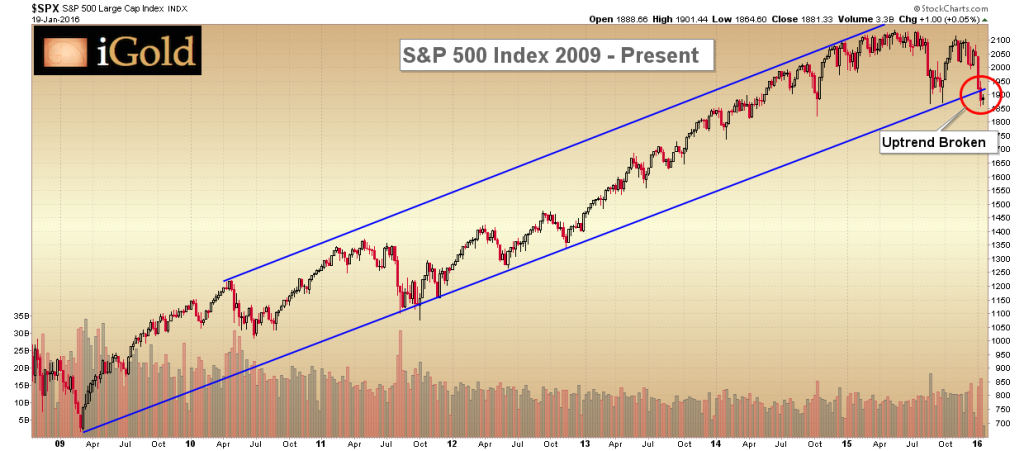
The US stock market, having risen relentlessly since the crash of 2008, has for the first time in seven years closed on a weekly basis below its major rising trend channel. The significance of such a technical breakdown cannot be understated: broken multi-year trends signify exactly that — change in a market direction. In this case, the transition we are witnessing is from a bull market to a topping pattern. After a topping pattern, bear markets follow.
Continue reading the full article for free on our partner site Gold Eagle…
a_SPX

Identifying Winners in the Business of Gold, Part II — Two Top Picks

Posted on Posted in Articles

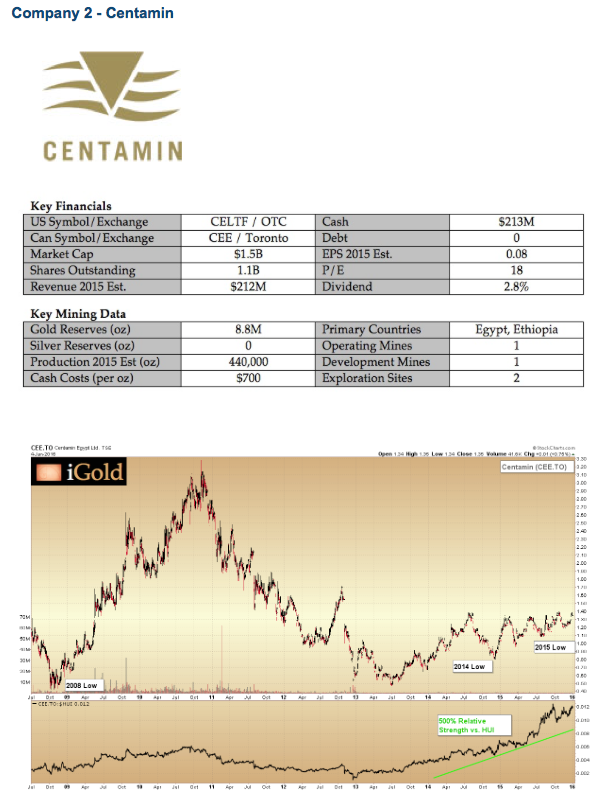
Last week we looked at a methodology for identifying select equities that have the potential to rise thousands of percent after a market crash. The technical criteria involves finding a market sector that has undergone a severe Stage IV decline (stage analysis, see graph below) and then scanning for individual companies that are significantly outperforming during the final parts of the crash (relative strength). These are the companies showing signals similar to Amazon in 2008, which has risen 1,100% since the crash of that year.

We have evaluated hundreds of gold mining stocks, and bring to you here two of the strongest examples for consideration. These are the companies that are poised to provide tremendous gains once the price of gold and the HUI Index stabilize and begin uptrends.

Centamin

Continue reading the full article for free on Gold Eagle…

Identifying Winners in the Business of Gold, Part I

Posted on Posted in Articles

Gold-miners-NUGGET2

Gold mining is a tough business. It has been said that more people became wealthy during the California Gold Rush of 1848-49 by setting up supply shops and hotels to serve prospectors than by actually mining for gold. Indeed in the modern era, there are over a thousand companies involved in the production and exploration of gold ore throughout the world — yet a significant percentage will wind up bankrupt, either unable to find sufficient gold in the first place or even more frustrating, unable to bring their known gold to the surface for a profit.

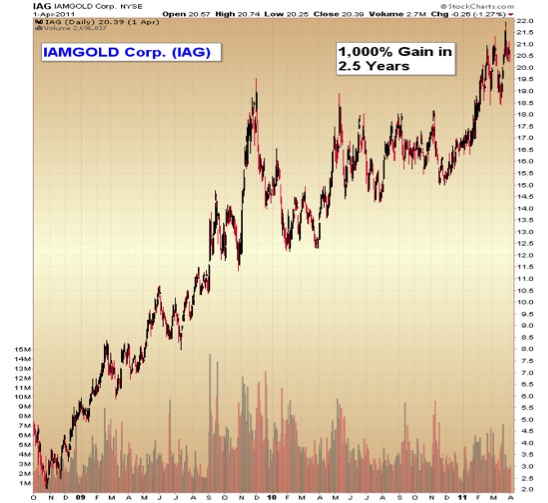
So why bother with the gold mining business at all? Because for those few who do succeed in this business, the gains can be phenomenal. Companies that find a significant deposit of gold and then successfully mine it can see gains in excess of 1,000% over the course of a few years.

B_IAG

Continue reading the full article for free on Gold Eagle…

Silver Leads World Asset Classes Post-Fed

Posted on Posted in Articles

aaron122015-1

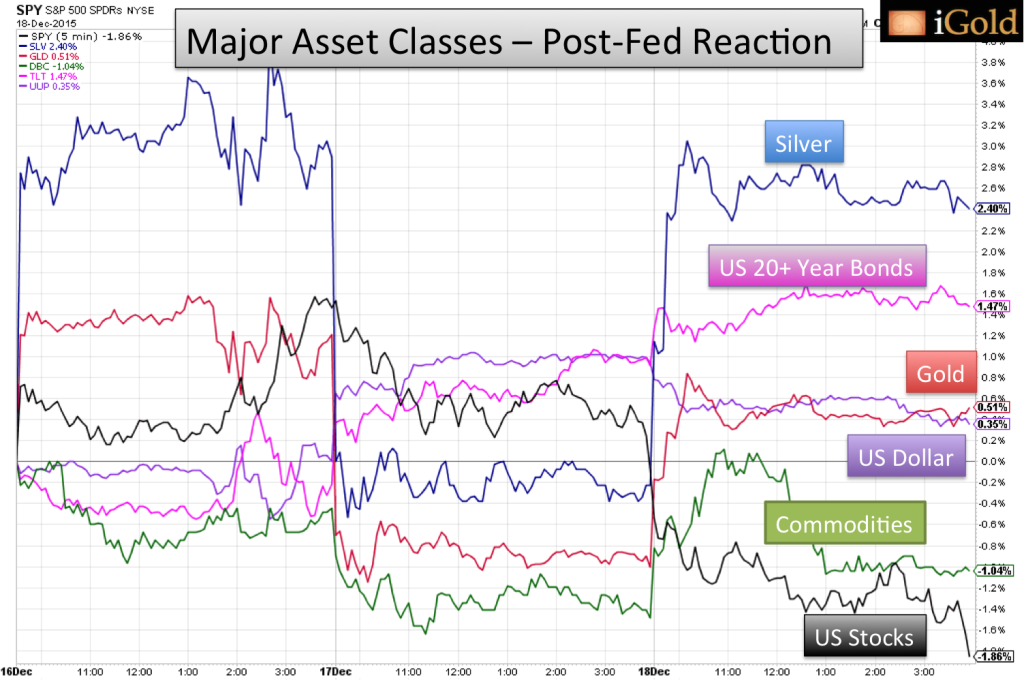
On Wednesday, the US Federal Reserve Board unanimously voted to raise interest rates for its overnight lending facility by 0.25%. This puts the target range set by the Central Bank to between 0.25 – 0.50%, with some leeway for rates to fluctuate within this zone.

The move was largely anticipated by the futures market, which began pricing in a near-certain interest rate hike in November. In theory, other world markets should not have reacted with much volatility following the decision, because the rate increase should have been priced in for related assets.

Yet interestingly, an analysis of major asset classes since the decision reveals some distinct price movements. While three days’ worth of trading certainly does not constitute a long-term trend, when viewed within the context of emerging patterns already present in major international markets, this type of analysis can provide valuable clues as to the developing shifts in underlying fundamentals.

Silver, seemingly forgotten after almost five years of declines, emerged as the leader after the rate decision, in major divergence with the rest of the commodity sector and even superior to the traditional safe-havens.

Continue reading the full article for free on Gold Eagle…

Rising Interest Rates? Expect Rising Gold Prices…

Posted on Posted in Articles

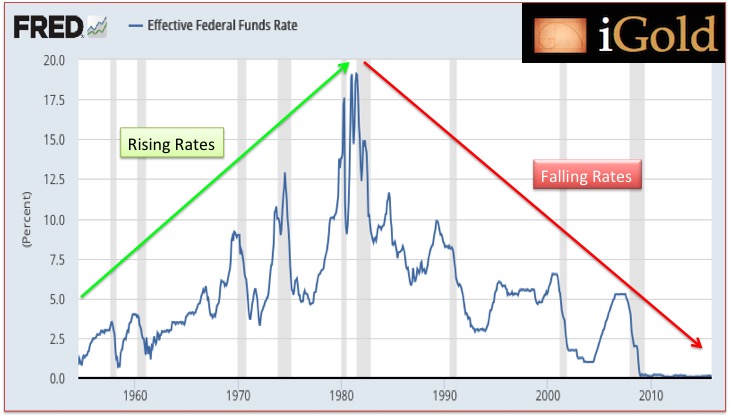
A_Federal Reserve Interest Rate History

There is much discussion in the financial press regarding the upcoming Federal Reserve meeting on December 15-16 and the likelihood of an increase in the Federal Funds Rate, which has been held close to 0% by the Central Bank since the financial crisis of 2008. The futures market is currently pricing in a significant chance for a rate increase to between 0.25 – 0.50% at the upcoming meeting. This, in turn, has made precious metals investors increasingly nervous in recent weeks, as many have come to believe that rising interest rates mean gold and silver will fall, due to an expected move higher for the US Dollar after the rate hike.

It is time to dispel this myth once and for all. Indeed, in 70 years of publicly available data from the Federal Reserve Board itself, we can very clearly see that rising short-term interest rates correspond to rising precious metals prices. Both recent examples and historic trends will illustrate this point.

Continue reading the full article for free on Gold Eagle…

Precious Metals Miners – A Historic Revaluation Will Occur

Posted on Posted in Articles

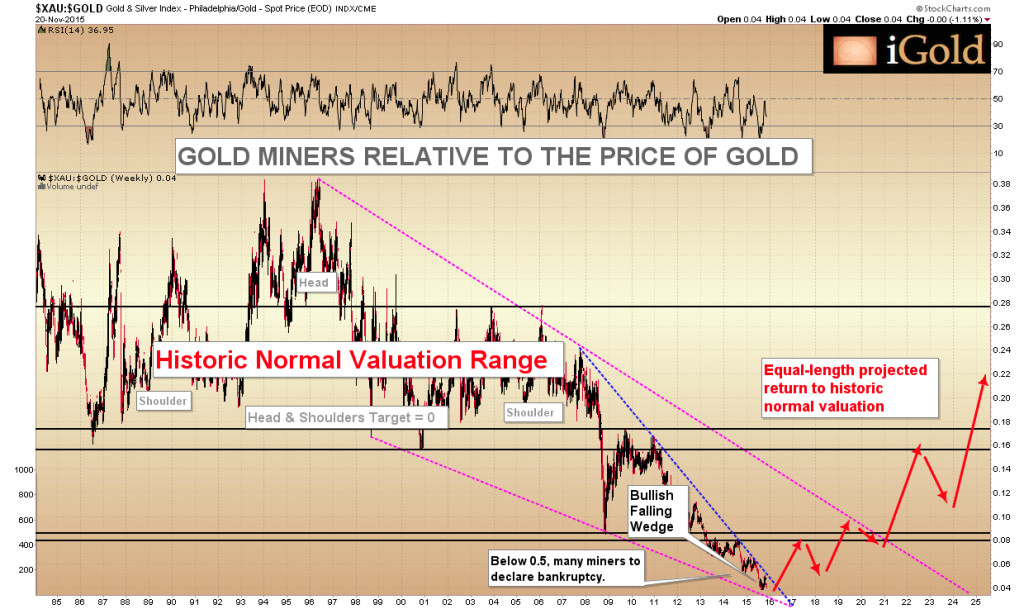
It is fairly common knowledge that the gold mining  industry has been one of the worst performing sectors in the capital markets over the last five years. From major established gold producers such as Harmony Gold Mining and Kinross falling to under $2 per share amidst doubts about their ability to service debt, to the bankruptcy or fire-sale takeover of countless junior exploration companies — the decline in gold prices over the last few years has spared few victims in the mining world.

Numerous fundamental reasons have been offered to explain the severity of the decline. Rising cash costs, an inability to finance exploration at favorable rates, and fears of mine nationalization have all been raised as reasons for the brutal bear market. While we can see merit to each possibility, as fundamental-based technicians we would rather let the market show us its opinion as opposed to trying to pinpoint a single scapegoat.

Given that we expect a historic low to be forming in gold over the course of the next 6-12 months (LINK: http://www.gold-eagle.com/article/gold-forecast-final-low-targets-bear-market), it seems appropriate to revisit the gold mining sector at this juncture to have a glimpse of what might be the fate of the surviving companies that actually dig the precious metal out of the ground.

Our analysis shows that a significant revaluation in this sector is due to begin over the course of the next 12-18 months. There are historical precedents for individual companies to see gains well in excess of 1,000% during these types of revaluations. Because even a small allocation of one’s portfolio to this thesis can have a tremendous wealth-building effect, we present the case here.

XAU Gold/Silver Miners to Gold Ratio

Continue reading the full article for free on Gold Eagle…

Gold Forecast: Final Low Targets For The Bear Market

Posted on Posted in Articles

In our previous article covering the long-term gold forecast, we made the case that the breakout in gold from the 1980 – 2009 consolidation below $850/ounce represents an extremely rare and powerful pattern in the commodity markets, a move that is likely to lead to decades of gains once the current bear market is over.

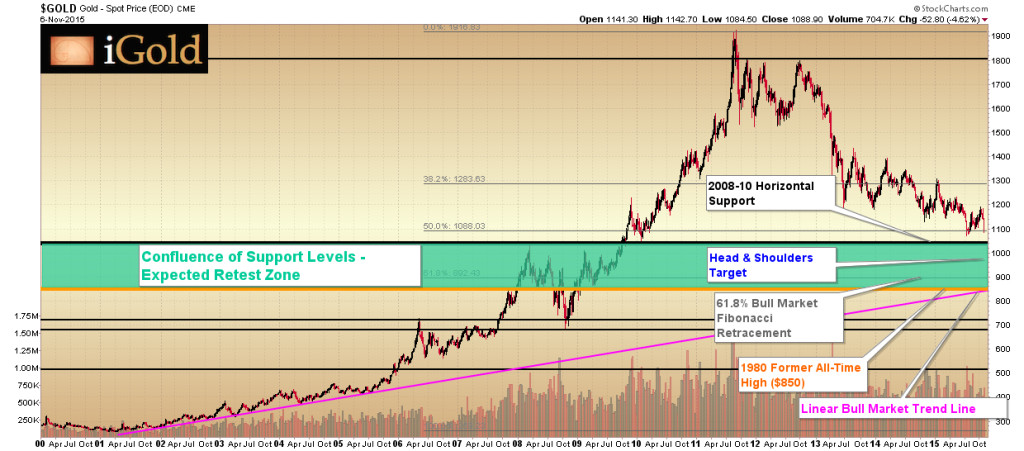
Given the recent weakness in the price of gold, we thought it a good time to update readers on our expectations for the final low of the current bear market. There is a confluence of no less than five important support levels between $850 and $1,033/oz. that we believe should provide support for the price of gold should further weakness develop over the months ahead. Such a final low would represent the best entry point for gold investors who have been waiting on the sidelines for prices to begin trending higher again.

Gold Expected Retest Zone

The Power of Multiple Support Levels

In our technical studies, when a single support level exists for a market, we will often say simply that support exists at that specific price point. When two support levels come in near the same region, we will say that this represents strong support at that area. And when three separate support levels exist in the same vicinity, that represents an extremely strong level of support.

On our 15-year gold chart, there now exist five separate support levels currently within a swath of roughly $180. This represents an immense level of buying power which should enter the gold market within this region. While the range may be too large for short-term traders to use in timing, for long-term investors who agree with our thesis that prices may eventually reach a multiple of the 2011 $1,917 high, any purchases in this band of support should represent an excellent long-term accumulation point.

Continue reading the full article for free on Gold-Eagle.com…

The Fundamental Case for Higher Silver Prices

Posted on Posted in Articles

In our previous article, we discussed the technical case for a significant long-term bottom now being put into place in the silver market, of magnitude comparable to the bottom we saw in late 2008, which led to a 400% rally in silver, and over 1,000% gains in many of the top-tier silver miners.

While we tend to focus on technical indicators in our analysis, the significance of such a pending rally in the precious metals forced us to take a step back and ask ourselves the question again: what are the fundamental drivers of such a pending move? What is actually going on amongst miners, scrappers, hedgers, jewelers, industrialists, and investors that is setting up for such a major revaluation of this historically monetary metal?

While we value studying charts and patterns — and indeed believe that all of the fundamental data that is known to the market (the sum of all participants in the sector) shows up in the charts (i.e. the current price) — we remain fundamental-based investors at heart. That is to say: we understand that fundamental drivers are what move the market over the long run.

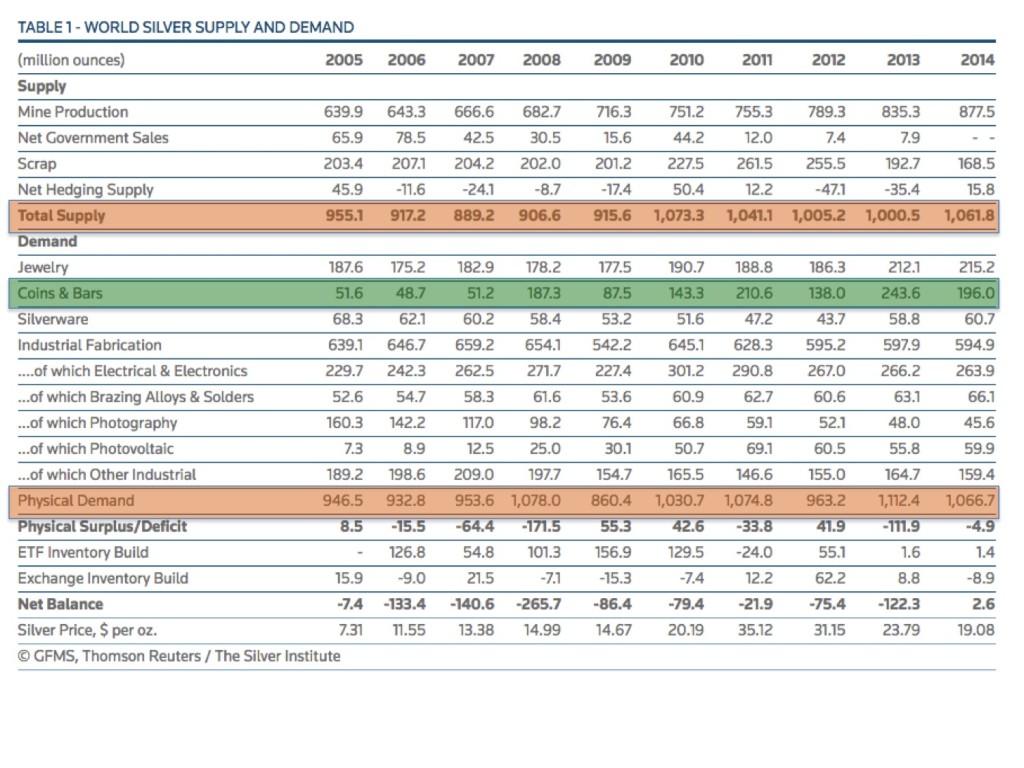
So we took a step back and sought to refresh our perspective by looking at the long-term trends developing on both the supply and demand sides of the silver market.

Silver FundamentalsOur review follows: we are more bullish than ever on silver prices and believe that the moves we have seen over the last 10 years are but a mere preview of the price level that is to come over the next decade.

Click here to continue reading the full article on our partner site, Silver Phoenix…

Silver Forecast: Technical Case for A Tremendous Silver Rally

Posted on Posted in Articles

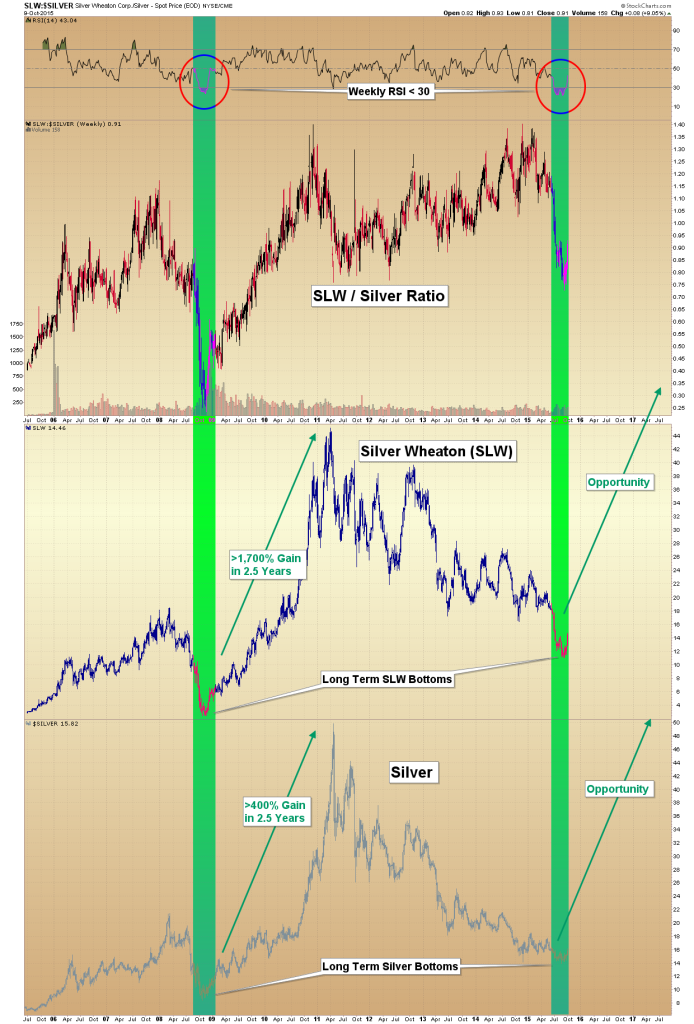
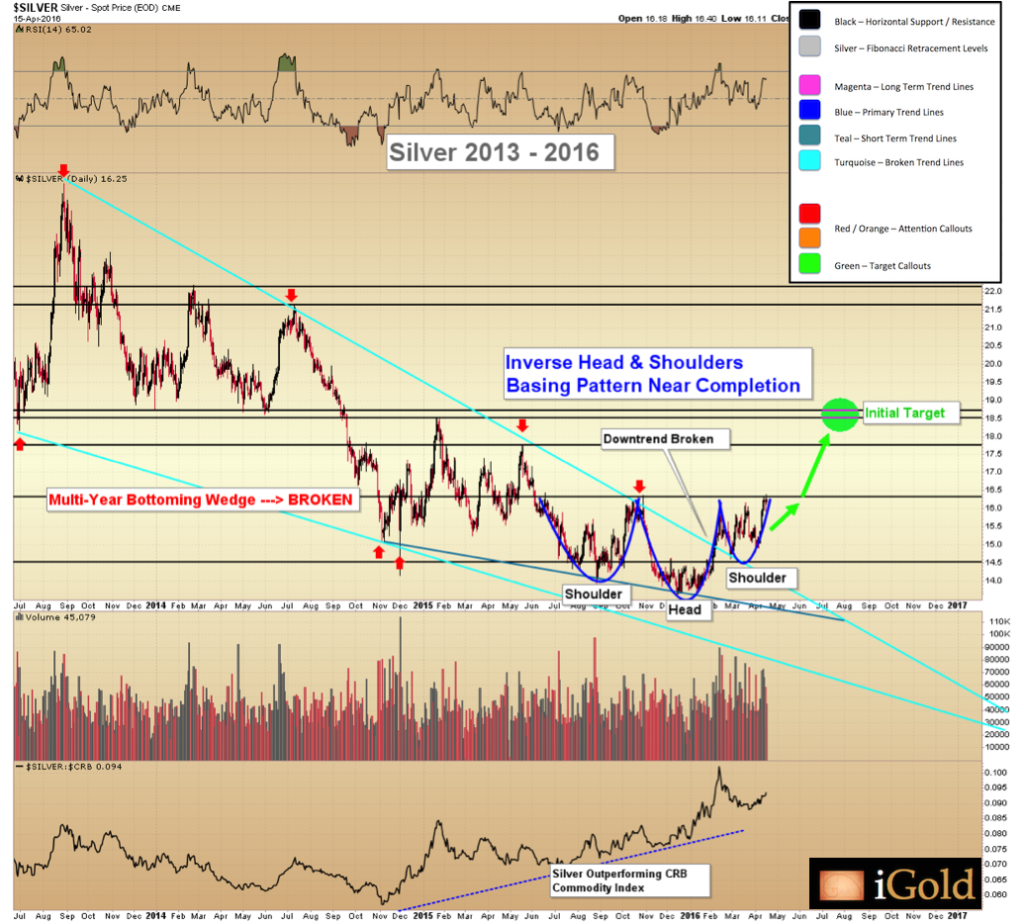
Our technical model is showing the completion of a downside capitulation signal for silver prices, indicating that a significant long term bottom is either already in place or will be finalized over the next several weeks across the silver market. Whether or not we see additional short-term weakness to the extent of a few dollars per ounce, the emergence from this pattern will represent a long term silver buy signal of similar magnitude to the one that occurred in November 2008, which saw silver rise over 400% within 2.5 years. Over the same timespan, certain silver miners saw gains well in excess of 1,000%.

We remain optimistic on silver due to fundamental supply/demand metrics, which include significant uptrends in investor demand since 2005 amidst mostly inelastic and stable industrial and jewelry demand. Such will be the topic for another article; in this feature, we focus on the technical side of the market and begin with an examination of our most important indicator: the relative strength ratio of the company Silver Wheaton (SLW) to silver bullion.

Continue reading the full article on Silver-Phoenix…


The SLW/Silver Metric

Gold Forecast: Multi-Decade Breakouts are Rare and Powerful

Posted on Posted in Articles

Gold is in the process of retesting its breakout from a multi-decade consolidation stretching back to 1980. The significance of such a retest cannot be understated: multi-decade consolidations usually lead to multi-decade advances, with targets many times the previous consolidation high. In percentage terms, gold has only just begun to move above its 1980 former all-time high, and for this reason, we believe it is critical for investors to view this market with sufficient historical perspective.

Multi-decade consolidations are a rare formation in the capital markets. By multi-decade consolidations, we are referring to markets in which an asset makes a specific price high, followed by at least two decades of price action below that high (the consolidation), followed by an eventual breakout above the high. In the case of the gold market, we are referring to the high made in 1980 at $850/ounce, followed by the 28-year consolidation below that high, until the breakout which finally exceeded $850 in 2008.

After oscillating above and below the $850 mark from 2008 through early 2009, gold prices finally took off for good in the fall of 2009, confirming the breakout. As we know, gold continued to accelerate into September of 2011, climbing to above $1,900. Since that time, the precious metal has been in a four year bear market, standing just above $1,140 as this article goes to press.

The critical piece of data in this chronicle is that the current four-year bear market has occurred entirely above the 1980 high. What this means is that this bear market represents a retest of the breakout from the former multi-decade consolidation.

Continue reading the full article on Gold-Eagle.com…


Gold's Multi-Decade Breakout
Gold’s Multi-Decade Breakout