Gold & Silver Price Analysis + Euro Gold Price
Welcome everyone back from the holidays. Today we look at the latest in the pending gold/silver bottoms, the Euro price analysis for both metals, and an updated view on the mining complex.
Last week we looked at a methodology for identifying select equities that have the potential to rise thousands of percent after a market crash. The technical criteria involves finding a market sector that has undergone a severe Stage IV decline (stage analysis, see graph below) and then scanning for individual companies that are significantly outperforming during the final parts of the crash (relative strength). These are the companies showing signals similar to Amazon in 2008, which has risen 1,100% since the crash of that year.
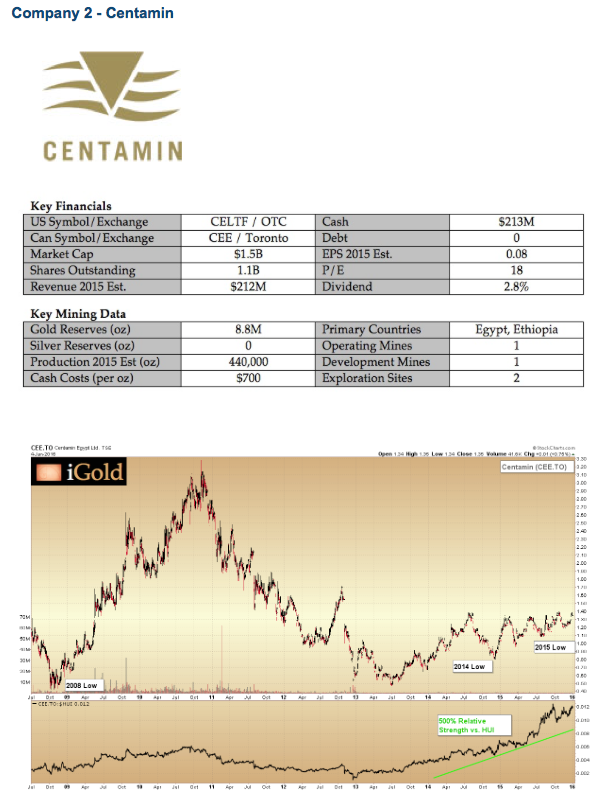
We have evaluated hundreds of gold mining stocks, and bring to you here two of the strongest examples for consideration. These are the companies that are poised to provide tremendous gains once the price of gold and the HUI Index stabilize and begin uptrends.


Gold mining is a tough business. It has been said that more people became wealthy during the California Gold Rush of 1848-49 by setting up supply shops and hotels to serve prospectors than by actually mining for gold. Indeed in the modern era, there are over a thousand companies involved in the production and exploration of gold ore throughout the world — yet a significant percentage will wind up bankrupt, either unable to find sufficient gold in the first place or even more frustrating, unable to bring their known gold to the surface for a profit.
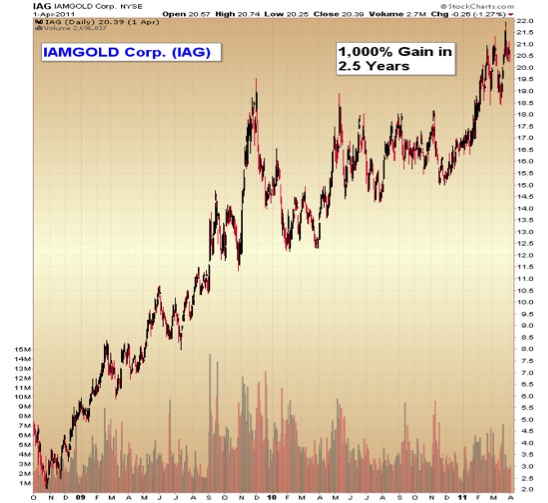
So why bother with the gold mining business at all? Because for those few who do succeed in this business, the gains can be phenomenal. Companies that find a significant deposit of gold and then successfully mine it can see gains in excess of 1,000% over the course of a few years.

Happy New Year!
Today we give our predictions for 2016, as well as analysis on the last week of trading in the gold and silver markets.
Each week we are also looking at the precious metals in different world currencies: today in the British Pound (GBP).

On Wednesday, the US Federal Reserve Board unanimously voted to raise interest rates for its overnight lending facility by 0.25%. This puts the target range set by the Central Bank to between 0.25 – 0.50%, with some leeway for rates to fluctuate within this zone.
The move was largely anticipated by the futures market, which began pricing in a near-certain interest rate hike in November. In theory, other world markets should not have reacted with much volatility following the decision, because the rate increase should have been priced in for related assets.
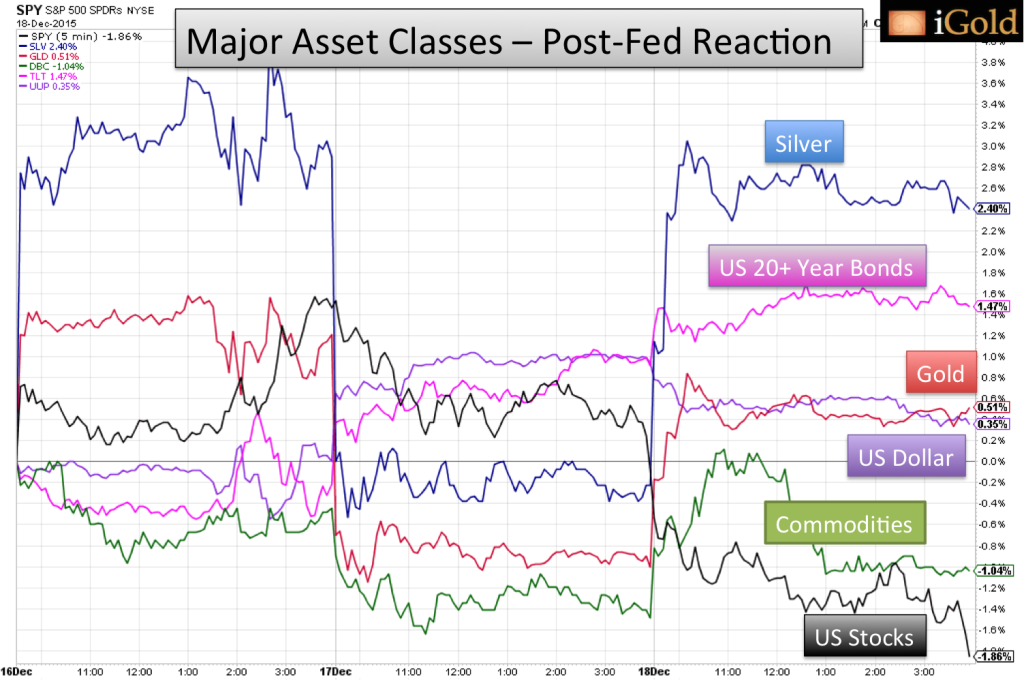
Yet interestingly, an analysis of major asset classes since the decision reveals some distinct price movements. While three days’ worth of trading certainly does not constitute a long-term trend, when viewed within the context of emerging patterns already present in major international markets, this type of analysis can provide valuable clues as to the developing shifts in underlying fundamentals.
Silver, seemingly forgotten after almost five years of declines, emerged as the leader after the rate decision, in major divergence with the rest of the commodity sector and even superior to the traditional safe-havens.
Silver showing outstanding leadership in the three days since the historic Federal Reserve rate hike. Let’s put this in perspective versus other world assets.
Also includes a quick review of the broad trends in play for anyone new to these videos. Welcome, I strive to provide the clearest analysis possible on the gold and silver markets.
A look at how various asset classes around the world finished today, after the historic Fed interest rate decision. How does this impact the lows forming in gold and silver?
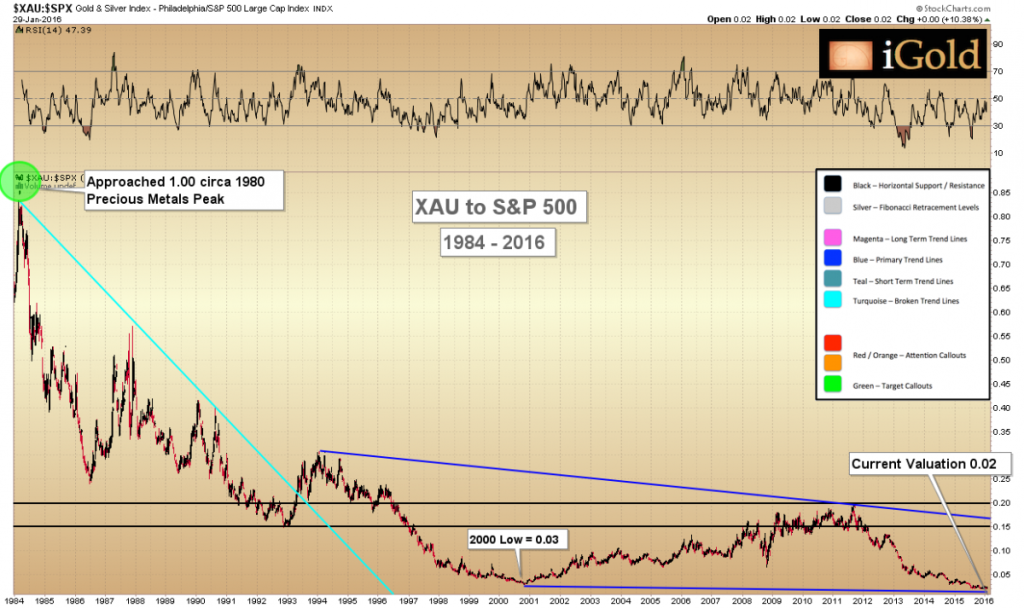
The last presentation before the Fed meeting on Wednesday, the markets seem to be pausing to get a better idea of what the Central Bank has in store. So we take this opportunity to look at one of the biggest fundamental backdrops for the price of the precious metals, the Dow / Gold ratio. What is this telling us is to come for both gold and silver?

There is much discussion in the financial press regarding the upcoming Federal Reserve meeting on December 15-16 and the likelihood of an increase in the Federal Funds Rate, which has been held close to 0% by the Central Bank since the financial crisis of 2008. The futures market is currently pricing in a significant chance for a rate increase to between 0.25 – 0.50% at the upcoming meeting. This, in turn, has made precious metals investors increasingly nervous in recent weeks, as many have come to believe that rising interest rates mean gold and silver will fall, due to an expected move higher for the US Dollar after the rate hike.
It is time to dispel this myth once and for all. Indeed, in 70 years of publicly available data from the Federal Reserve Board itself, we can very clearly see that rising short-term interest rates correspond to rising precious metals prices. Both recent examples and historic trends will illustrate this point.
Looking at the silver bottom in 2008 gives a good comparison to the current bottom that will be forming through 2016. Also looking at the worldwide debasement in currency playing out in Brazil.
A detailed look at the last week’s price of gold and silver. Nice early warning indicators from the mining complex gave us a valid signal for Friday’s move higher. Is the final low in place yet?
A special presentation in two parts — taking a historic look at the impact of Federal Reserve rate hikes on the prices of gold and silver. There has been a lot of concern that a rate hike might kill the precious metals, but how much should we really worry?
Continuing with our mid-week analysis, an update on the current action in gold and silver in anticipation of the Fed meeting. Strong bottoming signals are still coming in.
Thank you for watching. We strive to be your independent source for clear and intelligent analysis of the precious metals markets.

It is fairly common knowledge that the gold mining industry has been one of the worst performing sectors in the capital markets over the last five years. From major established gold producers such as Harmony Gold Mining and Kinross falling to under $2 per share amidst doubts about their ability to service debt, to the bankruptcy or fire-sale takeover of countless junior exploration companies — the decline in gold prices over the last few years has spared few victims in the mining world.
Numerous fundamental reasons have been offered to explain the severity of the decline. Rising cash costs, an inability to finance exploration at favorable rates, and fears of mine nationalization have all been raised as reasons for the brutal bear market. While we can see merit to each possibility, as fundamental-based technicians we would rather let the market show us its opinion as opposed to trying to pinpoint a single scapegoat.
Given that we expect a historic low to be forming in gold over the course of the next 6-12 months (LINK: http://www.gold-eagle.com/article/gold-forecast-final-low-targets-bear-market), it seems appropriate to revisit the gold mining sector at this juncture to have a glimpse of what might be the fate of the surviving companies that actually dig the precious metal out of the ground.
Our analysis shows that a significant revaluation in this sector is due to begin over the course of the next 12-18 months. There are historical precedents for individual companies to see gains well in excess of 1,000% during these types of revaluations. Because even a small allocation of one’s portfolio to this thesis can have a tremendous wealth-building effect, we present the case here.

Today we compare gold to the value of the US Dollar. Is it true that the two always move in opposite directions? Also our update on the lows forming in silver and gold prices.
Gold breaks to a new low below $1,075 while silver holds above $14 over the last three days. Looking for bottoming divergence in the gold & silver miners, plus updated metals charts.
A detailed look at how the bottoming process should play out in gold and silver prices. These are referred to as Stage 1 bases that are being formed presently. What prices will we be watching for after the bases form?
Today we continue zooming in to watch the retests of the July lows for gold and silver. Also, a look at two important fundamental drivers for the long-term valuations: the CPI and gold as a percentage of world assets.
We are watching very closely the retests of the July lows at $1,075 for gold and $14.00 for silver. An update on the last few days in the precious metals markets, and what should happen if prices break lower. Also, are the gold/silver mining companies giving us any clues yet on the bottom?
In our previous article covering the long-term gold forecast, we made the case that the breakout in gold from the 1980 – 2009 consolidation below $850/ounce represents an extremely rare and powerful pattern in the commodity markets, a move that is likely to lead to decades of gains once the current bear market is over.
Given the recent weakness in the price of gold, we thought it a good time to update readers on our expectations for the final low of the current bear market. There is a confluence of no less than five important support levels between $850 and $1,033/oz. that we believe should provide support for the price of gold should further weakness develop over the months ahead. Such a final low would represent the best entry point for gold investors who have been waiting on the sidelines for prices to begin trending higher again.
In our technical studies, when a single support level exists for a market, we will often say simply that support exists at that specific price point. When two support levels come in near the same region, we will say that this represents strong support at that area. And when three separate support levels exist in the same vicinity, that represents an extremely strong level of support.
On our 15-year gold chart, there now exist five separate support levels currently within a swath of roughly $180. This represents an immense level of buying power which should enter the gold market within this region. While the range may be too large for short-term traders to use in timing, for long-term investors who agree with our thesis that prices may eventually reach a multiple of the 2011 $1,917 high, any purchases in this band of support should represent an excellent long-term accumulation point.
Continue reading the full article for free on Gold-Eagle.com…
Today’s video update covers both gold and silver. The metals are at critical junctures. Gold is nearing a retest of its bear market lows, while silver is holding slightly above those levels. We also take a look at the gold to silver ratio: how many ounces of silver does it take to buy one ounce of gold? What might the ratio move to in the near future?
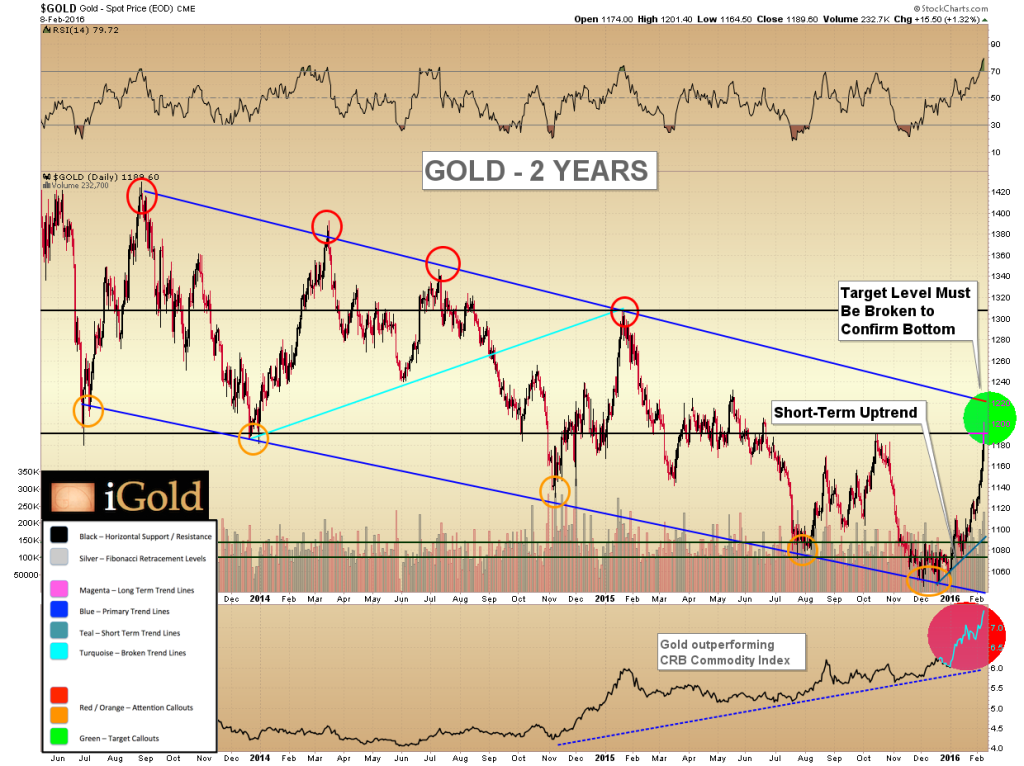
Gold has been weak in the last few days, breaking through our short-term uptrend of the last several months. We give our analysis for the potential lows coming into place over the next few months should the $1,075 August low fail to hold.
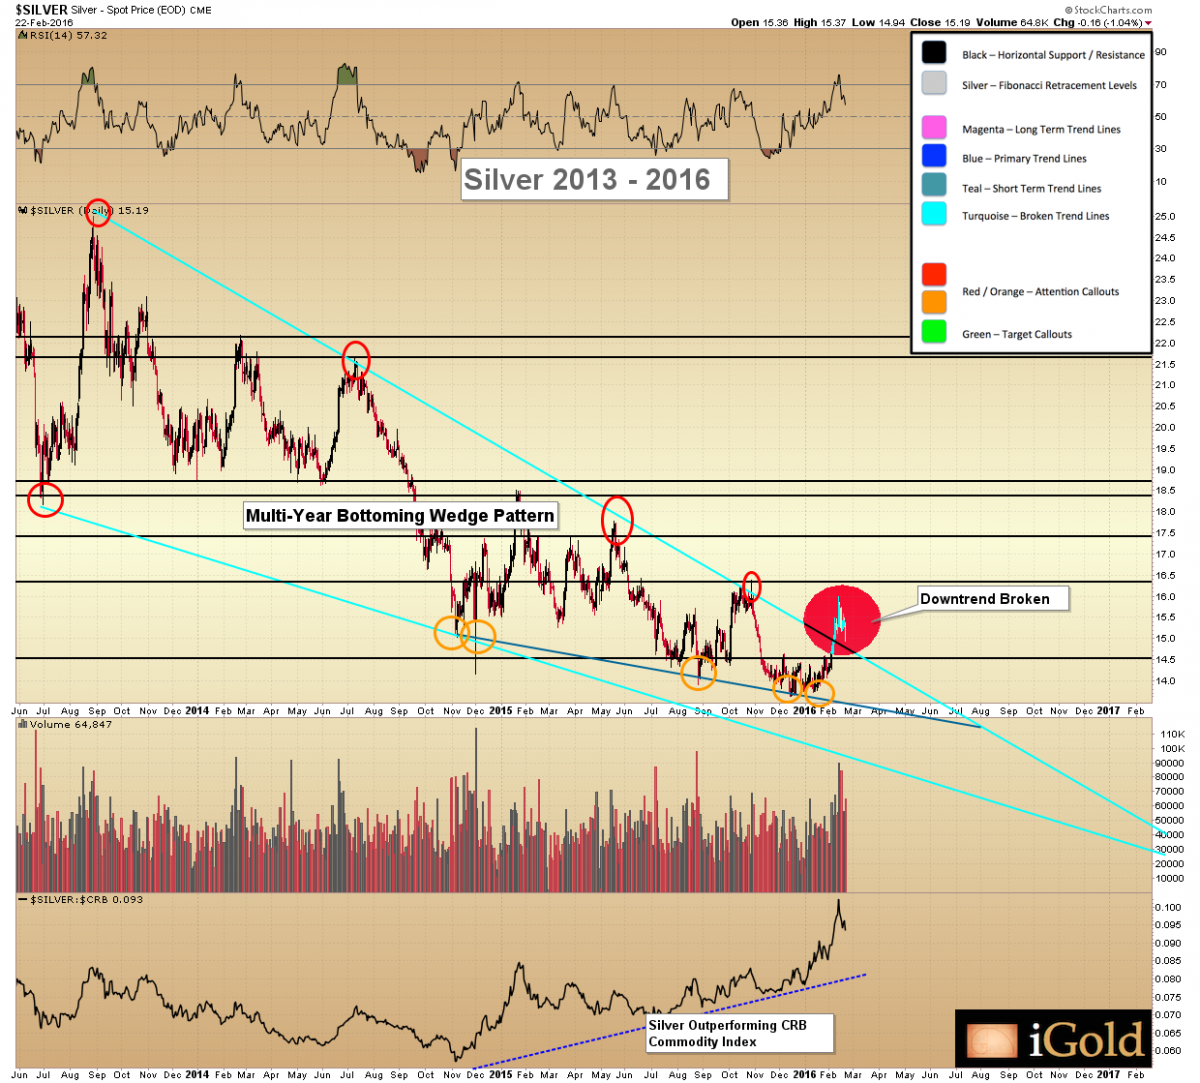
Since the false breakout one week ago, silver has been weaker as we predicted. The battle to break out of the downtrend continues… how much lower will it go before the next attempt?
Silver has been weaker since failing to break its 2-year downtrend on Wednesday. Gold is coming back into a high probability retest zone of its yearlong downtrend. How much lower should they fall before the precious metals attempt another breakout?
All the latest analysis on gold and silver price movements since the Federal Reserve meeting on Wednesday.
In our previous article, we discussed the technical case for a significant long-term bottom now being put into place in the silver market, of magnitude comparable to the bottom we saw in late 2008, which led to a 400% rally in silver, and over 1,000% gains in many of the top-tier silver miners.
While we tend to focus on technical indicators in our analysis, the significance of such a pending rally in the precious metals forced us to take a step back and ask ourselves the question again: what are the fundamental drivers of such a pending move? What is actually going on amongst miners, scrappers, hedgers, jewelers, industrialists, and investors that is setting up for such a major revaluation of this historically monetary metal?
While we value studying charts and patterns — and indeed believe that all of the fundamental data that is known to the market (the sum of all participants in the sector) shows up in the charts (i.e. the current price) — we remain fundamental-based investors at heart. That is to say: we understand that fundamental drivers are what move the market over the long run.
So we took a step back and sought to refresh our perspective by looking at the long-term trends developing on both the supply and demand sides of the silver market.
Our review follows: we are more bullish than ever on silver prices and believe that the moves we have seen over the last 10 years are but a mere preview of the price level that is to come over the next decade.
A look at how today’s non-decision by the Federal Reserve impacted the precious metals and stock markets. Silver seems to be caught in the middle of its industrial and investment demand. Gold still working toward our $1,230 target while silver has just had a failure to break out of its downtrend today. There may be more moderate weakness for silver in the next few weeks.