Focus on the GDX gold miners
Today we take a sidestep from the usual analysis on physical metals to zoom in on the action in the gold & silver mining complex, with a focus on the GDX and stage analysis.

Today we take a sidestep from the usual analysis on physical metals to zoom in on the action in the gold & silver mining complex, with a focus on the GDX and stage analysis.
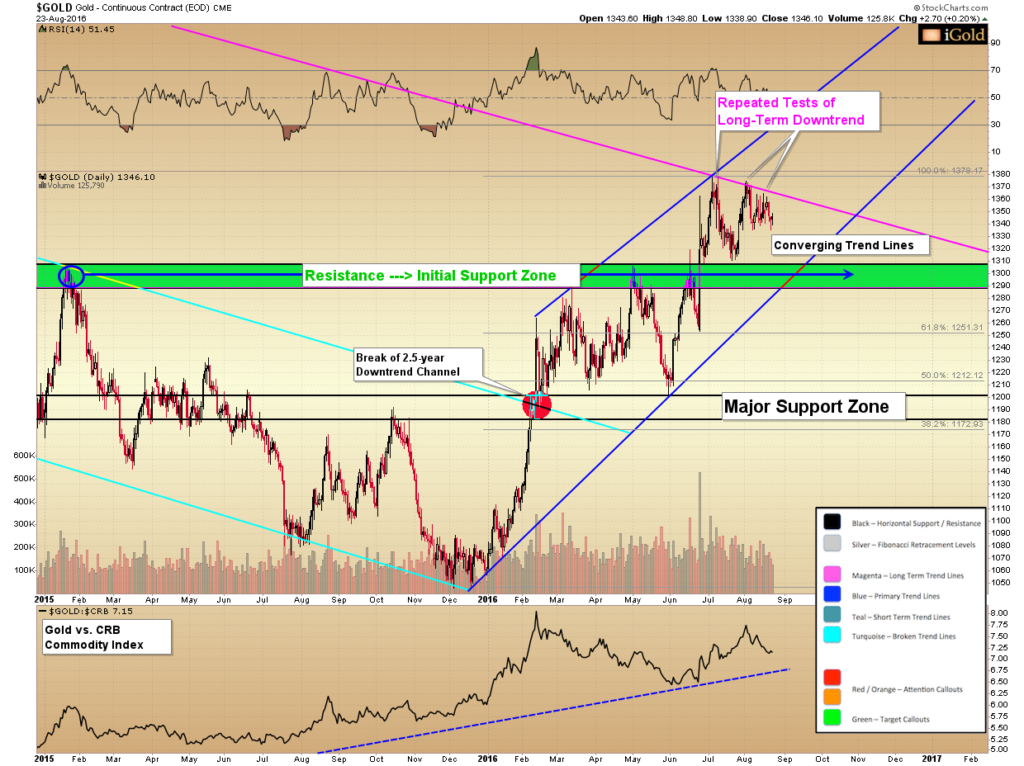
Gold finds itself directly in the crosshairs of a battle between precious metals bulls and bears. The bears are attempting to hold the metal down at this level, because a breach of a long-term trend line would be a major technical event in the eyes of many investors. It would be a signal to the mutual funds and institutions waiting on the sidelines that the 2011-2015 bear market is decisively over.
Having been mostly on the sidelines from 2011-2015, we are in the bullish camp at this juncture. Consequently, have a reasonable expectation that this long-term down trend will be broken in the near future, possibly as early as September.
Why September For A Gold Breakout?
Click here to continue reading the full article for FREE on our partner site Gold Eagle…
Gold continues to consolidate right below its long-term 2011-2015 downtrend breakout.
Plus, a look at recent news regarding a failed Bank of England bond purchase, and what that means for the psychology of the bond market.
Gold is now making a second attempt at breaking out from its long-term downtrend, in place since 2011.
An update on the valuation of the gold mining sector versus the broad economy.
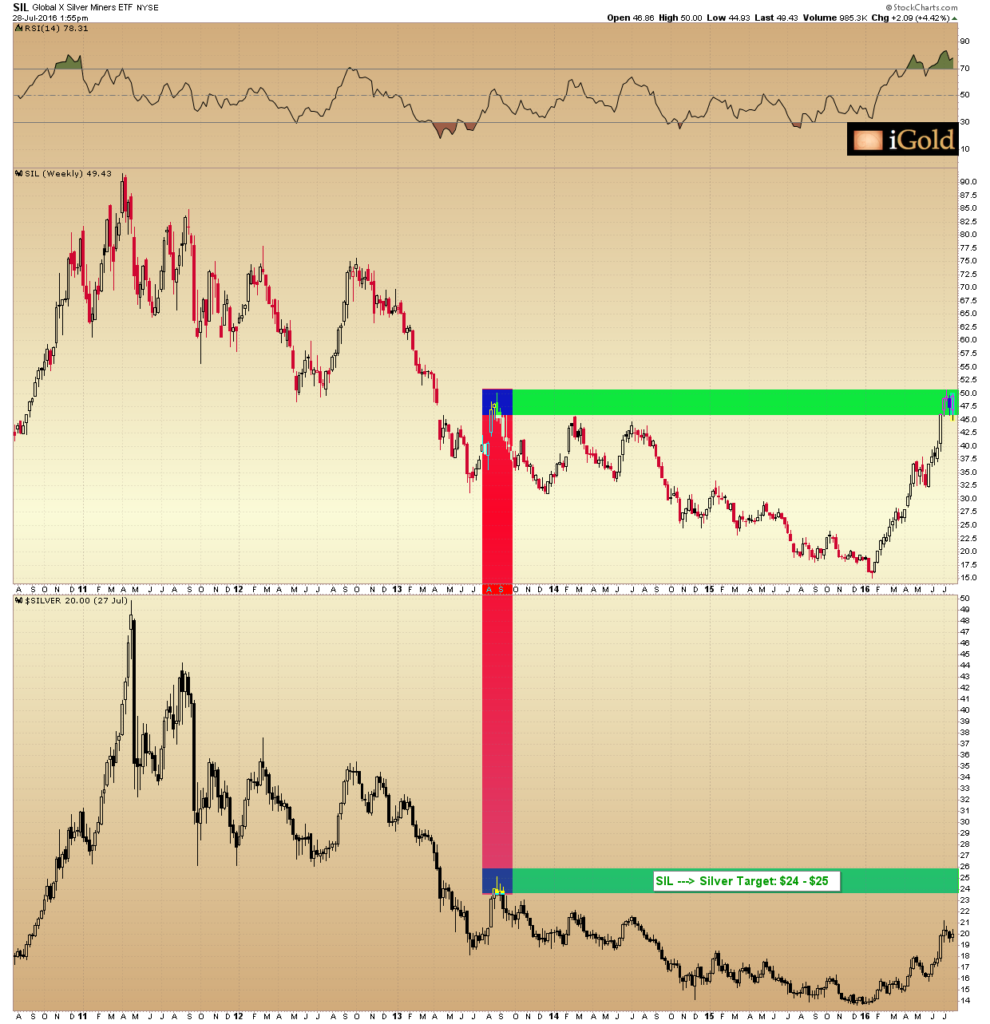
Silver miners are now factoring in sales prices for silver of between $21.50 and $36.00, depending on which miner we are analyzing. When we perform this analysis on a wide basket of producing companies, we find a high confluence of targets in the $24.00 – $25.00 spot price level.
The major point is that the primary surge higher off the December 2015 bottom has further to go for silver.
Nearly all major silver miners are pricing in higher spot silver prices for their revenue streams. Although we are now directly within the weakest season for the precious metals (summer), the silver miners are predicting another advance in prices either late this summer or into the fall.
Click here to continue reading the full article for free on our partner site, Gold Eagle…
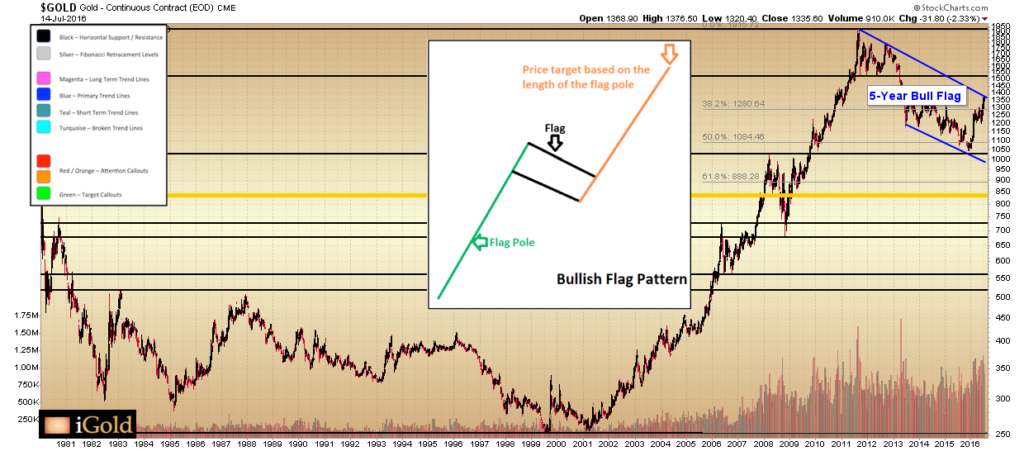
The 2011-2016 decline was a pause in a generational bull market for precious metals.
Current prices will be seen as one of the last great buying opportunities when we look back a decade from now. The bull flag pattern is nearing completion. Moreover, a strong advance above $1,400 will be the trigger that manifests growing recognition for gold as a worthy component of investors’ portfolios. The long-term targets ahead of us are significantly higher than current prices. The ramifications of such targets for silver, the currency markets, and the mining sector will be discussed in future articles.
Click here to continue reading the full article for free on our partner site, Gold Eagle…
Gold is bumping against its final long-term downtrend dating back to 2011. Meanwhile silver is holding up well above $20, but at some point there will be a retracement… we give the likely targets here.
Today we look at the generational opportunities that are setting up in the gold and silver miners… then in gold… and then in silver.
If you are serious about making investments in this sector, this deserves your attention. Come up with a plan, understand the potential, and carry through with it.
Thank you for continuing to tune in. I am extremely pleased with the number of people who have benefited from this information over the last 6-12 months. We are just getting started — violent corrections will be happening, but there is much more potential ahead ahead of us.
Gold breaks out from its 18-month consolidation after the Brexit vote. Meanwhile, silver is not too far behind.
The British pound suffers some of the biggest drops seen in currency markets in multi-decades…
Today we discuss big picture setups for gold and silver, and look at the spectrum of reward vs. risk that exists in the precious metals.
There are significant opportunities ahead but it is critical for individuals to follow an ancient Greek philosophy when it comes to investing in gold or silver…
Congratulations to anyone who participated with us in this silver trade. A stellar surge was seen today, up over 80 cents from yesterday’s lows. Today we highlight what we expect for both metals over the rest of the summer.
Some people have asked about a service to alert you to trade opportunities in silver such as we saw today. If this is something that interests you, please send an email using the link below, as we are investigating the possibility of something like this for the future:
https://igoldadvisor.com/contact/
Thank you for watching, and best success in the week ahead.
The grinding nature of gold’s price action, since the surge in February, has left many investors concerned. Why hasn’t the metal continued to build upon the gains of earlier this year?
Nothing in nature moves in a straight line. Gold, a fundamental element of nature, and the markets, being the sum of human nature, are no different.
Consolidations are very healthy for markets. They represent a shifting of ownership from weak hands to strong.
We view any price action above the bottom end of our green highlighted zone at $1,176 to be an ideal setup for a strong continuation move later this year.
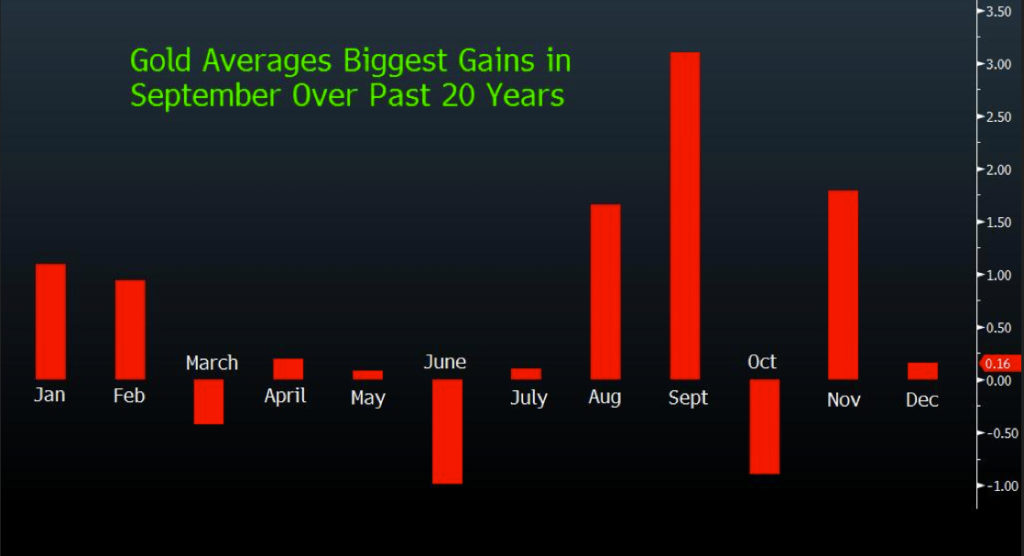
The reason? If gold can consolidate during this — the seasonally weakest period of the year — it will mean new demand is showing up in the market even during the months that we typically expect to see buyers largely absent.
Below we show the gold seasonality chart for the past 20 years. Note that demand typically picks up starting mid/late August and remains rather strong through February. Meanwhile, the March – July timeframe usually represents the weakest season for gold.
This is why we believe that if gold can buck the seasonal trend, and merely consolidate through the mid-summer, the precious metals will actually be showing underlying strength — and will be setting up for a significant rally this fall.
Continue reading the full article for free on our partner site Gold Eagle…
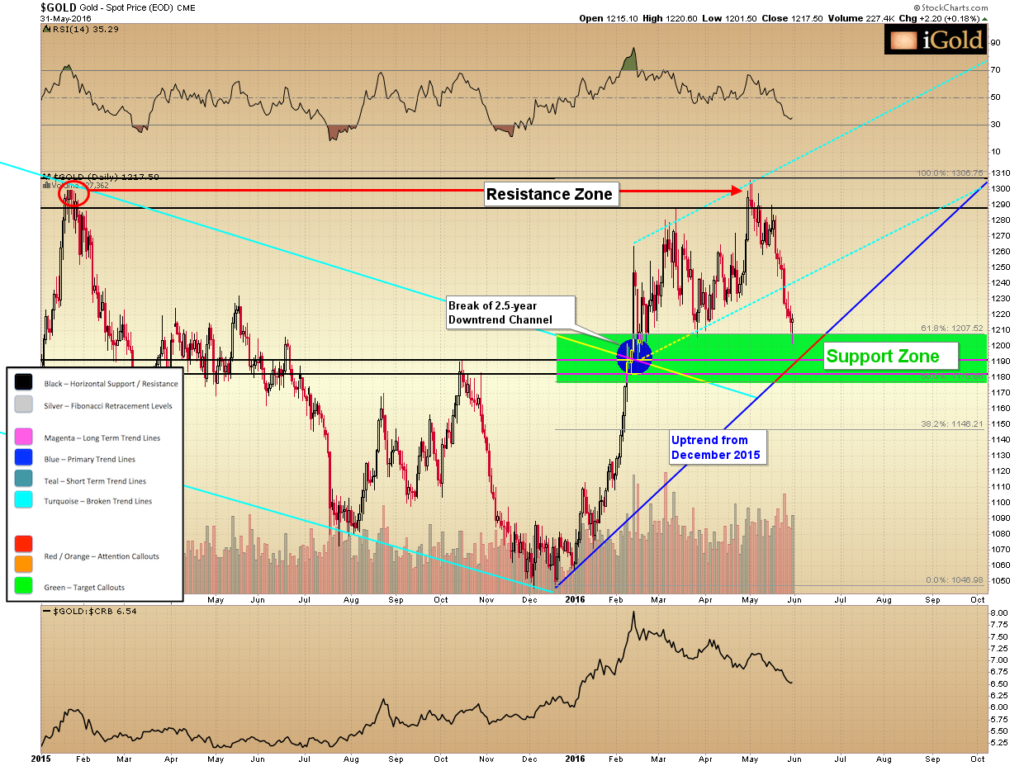
Gold has now fallen for four weeks in a row and has come back into an important technical support zone. This is the lower range of the anticipated trajectory we have been outlining for some months. We expect prices to now begin to carve out a bottom, though this process may take some weeks to play out. Consequently, the final low may not be in place yet.
Last Friday, gold closed down $37 or some 3% from a week prior to finish at $1,215 per troy ounce.
The technical action warrants a thorough discussion, and for that we refer to the following 18-month chart of spot gold:
First, note that gold has now fallen $105 from it’s recent $1,306 high. This is an 8% decline. It is fascinating to watch the shift in investor psychology with such a modest correction, as we observe a lot of fear in the precious metals sector at this time.
Of course, as investors in not only the physical metals but also the precious metals mining sector, we can see how such relatively small moves in the metals can translate into tremendous swings in the valuations of these companies. In gold’s 22% move higher in gold from December through April, we saw 100-200% gains across many gold mining companies; and now, with the 8% drop lower in gold prices, we have seen 20-40% corrections across these same equities.
What type of gains will the mining sector see at $1,400…$1,500…$1,900 gold?
But, let’s get back to the current price of spot gold. The price has broken through our short-term upward sloping trend lines, which are now shown above in turquoise for reference. This short-term technical breakdown means that gold will need to consolidate for some time before it is ready to advance through the $1,305 region that now serves as resistance.
Continue reading the full article for free on our partner site Gold Eagle…
Gold & Silver are approaching important support zones on the charts where we expect bottoms to form, and silver is setting up for a strong trade opportunity in the near future.
All the latest action in gold and silver, including a comparison to the 2008 bottom in silver.
Meanwhile, there is a shakeout underway in the gold and silver mining equities. We should expect these every few months — as the markets attempt to shake investors our and make us lose our positions. Let us not lose sight of the big picture.
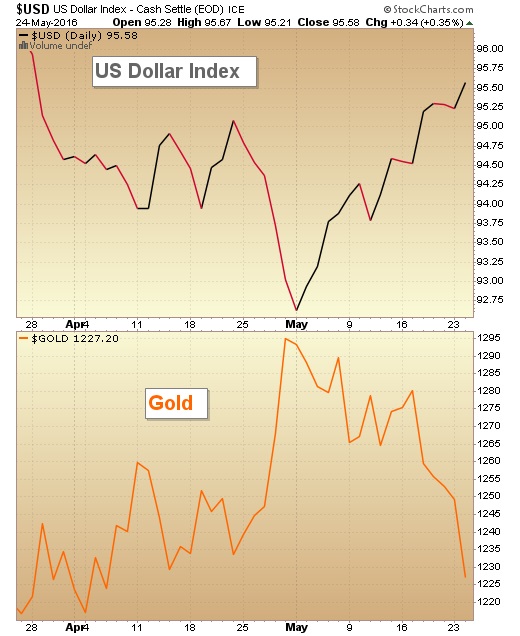
Gold has been weak over the last few days, falling back down to $1,225, as this article goes to press. The major contributor to gold’s fall has been strength in the U.S. dollar since last Wednesday, when the Federal Reserve released minutes from its most recent policy meeting, hinting at a stronger chance of a rate hike at its upcoming June session. Higher interest rates tend to strengthen the value of the dollar versus foreign currencies, as investors can achieve a higher rate of return by holding US-denominated debt.
Over the short run, a stronger dollar often corresponds to weaker gold prices, as traders see less need for the age-old metallic store of wealth when the fiat dollar is firming.
Indeed, when we look at the very short-term action in the U.S. Dollar Index versus gold, we can clearly see this inverse correlation. Note how the recent high for gold at $1,305 corresponded within one day to the low seen in the Dollar Index at 92.5. Since then, as the dollar has risen, gold has fallen:
It is tempting to want to extrapolate this phenomenon into longer time periods. For example, what if the dollar continues to rise? Will gold keep falling?
U.S. Dollar Index – Meaningless Over the Long Run
We want to caution readers that over the long run, the value of the US dollar versus other international currencies (which is what the U.S. Dollar Index measures) has little impact on the price of gold. We must remember that in today’s monetary system, for the first time in the history of human civilization, not a single currency has any direct tangible backing to it. Thus, measuring the U.S. dollar versus the Euro, the British pound, or the Australian dollar is a relative measure of one fiat currency versus another. Each currency is being debased – simply at different speeds.
Over the long run, the U.S. Dollar Index has little impact on the price of real assets such as gold, silver, land, or other commodities. We can see this when we back out our chart above to a generational time frame.
Below we show the U.S. Dollar Index and gold since 1980. We have picked the recent figure on the Dollar Index at 92, and then drawn highlights to show the corresponding gold price at other times throughout the last few decades when the index matched the same 92 level.
Note how over these decades, while the dollar index has essentially gone nowhere, oscillating above and below the 92 figure, gold has seen the following four prices: $450 in 1988, $300 in 1998, $450 in 2005, and $1,300 in 2016.
Note also that gold’s high of $1,900 in 2011 did not match the dollar’s low of 72 in 2008. Nor did the dollar’s high in 1985 match gold’s low in 1999.

The Dollar Index is meaningless for gold prices over the long run. Gold is moving independently of any relative fluctuations between fiat currencies.
In other words, gold’s rise must be a worldwide event.
Continue reading the full article for free on our partner site Gold Eagle…
A drop in the after-hours market for gold and silver today after the Fed released a statement indicating it might raise interest rates in June. Should gold and silver investors fear?
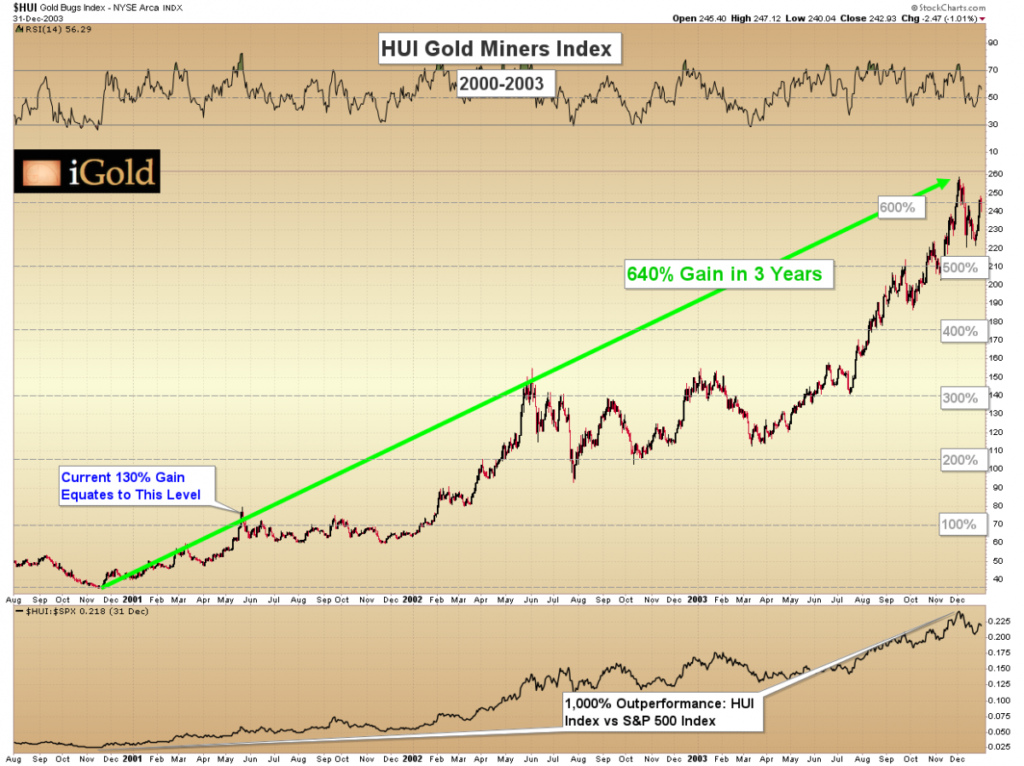
While gold is up $230 from December for a gain of 22% and silver has added $3.45 for a 25% gain over the same time frame, the real news in the investment world has been the action in the gold and silver miners. Indeed, from the winter lows, the HUI Index of gold and silver mining equities is up an incredible 130%, far outpacing the gains mentioned above in the precious metals themselves.
Is it too late for investors to participate in this move? To attempt to answer that question, in this article we look at the mathematics behind the mining industry and some historic valuation metrics for the gold and silver miners compared to other economic assets.
Continue reading the full article for free on our partner site Gold Eagle…
Gold is “chipping away” at the resistance near $1,305 while silver looks healthy within the $16.75 – $18.50 zone….
In the second half of today’s video we look at historic volatility, for those who are invested in the gold and silver mining sector. Prepare for a wild ride with the potential for life-altering gains.
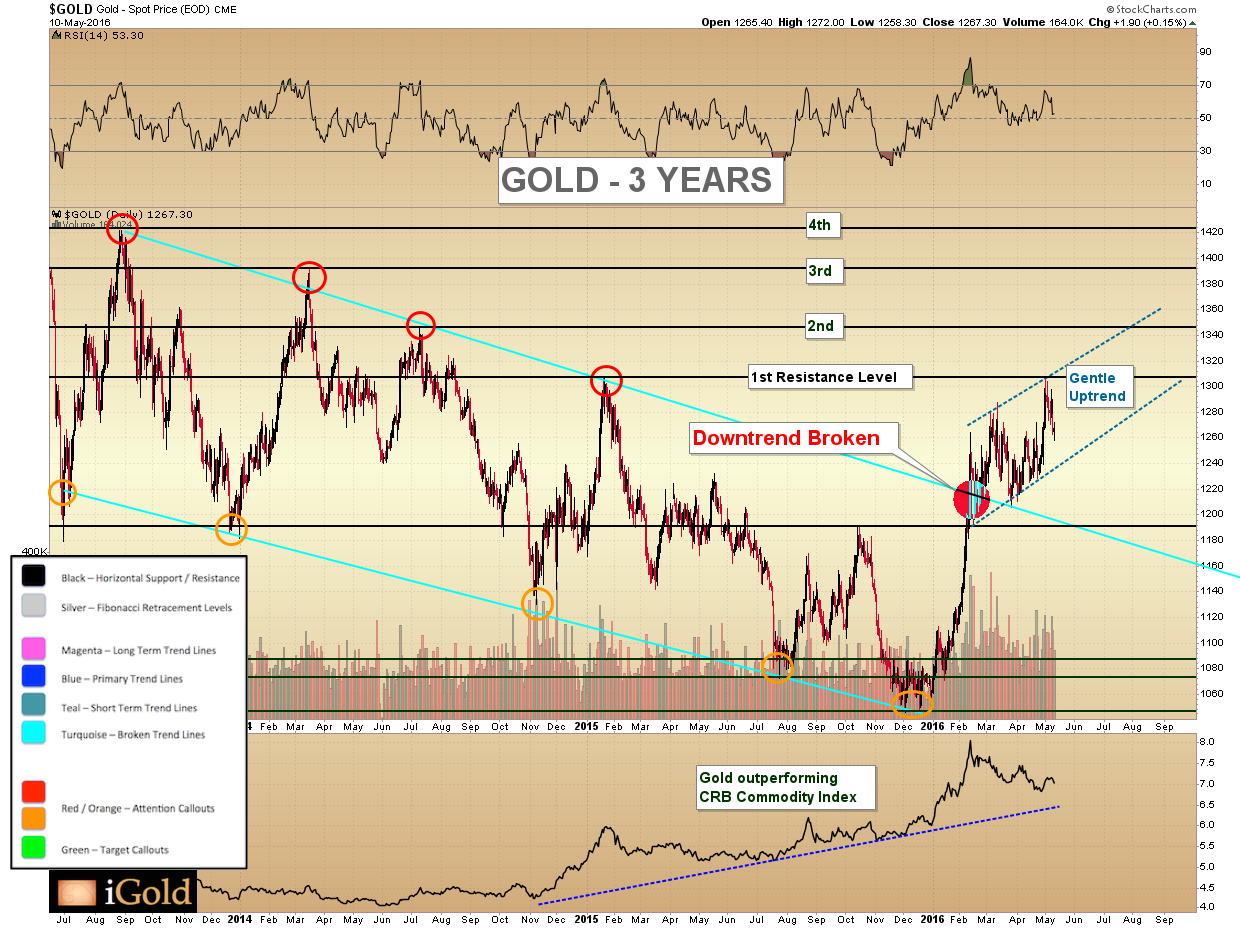
Gold continues to show underlying strength despite volatility that is leaving many investors sitting on the sidelines.
Bears are frustrated that the predicted collapse in the precious metal has not yet materialized.
Bulls are expecting a skyrocket higher any day.
Yet a third possibility exists, and there is still time to take a middle road in one’s perceptions. Ironically, such a moderate view might just end up being the most profitable in the long run.
Indeed, the philosophy of Aristotle’s aptly-titled “Golden Mean” itself encourages us to consider the middle path, and so we begin with an examination of the gentle uptrend currently in place in the gold market.
Continue reading the full article for free on our partner site Gold Eagle…
Today we look at gold and silver prices around the world for confirming indicators of a new bull market. Currencies include:
-US Dollar
-Canadian Dollar
-British Pound
-Euro
-Australian Dollar
Gold is up nearly 21% from its December 2015 lows. Moreover, silver has added an impressive 28% to its price during the same timeframe. Most notably, the HUI gold and silver mining index is up over 100% during this period.
Despite the strong performance we have seen from the precious metals complex thus far in only the first few months of 2016, many fear that the move is already nearing an end. Readers should be aware that the potential for both gold, silver, and strong mining equities is much greater than the moves seen thus far. Indeed, a review of the metals and several valuation metrics over a longer time frame can provide us with clues as to what we should expect through the later part of this decade.
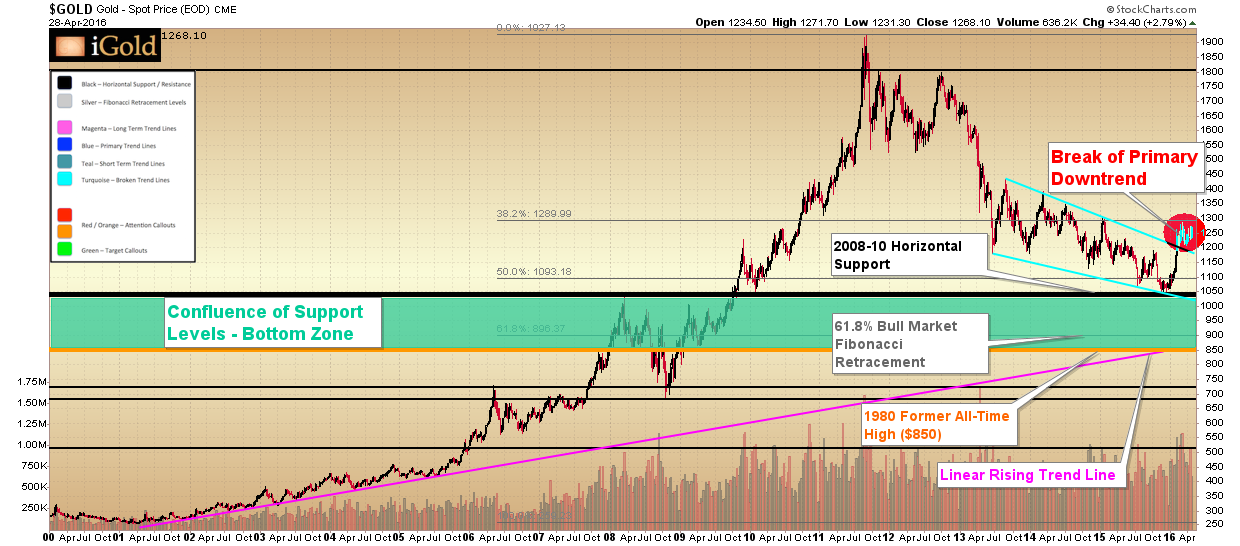
Below we review the long-term perspective for gold since the year 2000. Gold bottomed in 2001 after a nearly 20-year bear market following the peak in 1980 at $850/oz. The return advance to again challenge the $850 level took eight years, although it was not until the following year (2009) that prices decisively broke through this level for good.
Gold then advanced for two years above the former all-time high, hitting $1,917/oz in 2011, before falling back some 45% over the course of nearly five years through the end of 2015.
Markets that consolidate for 29 years (1980 – 2009) below an important peak level ($850) do not finish their subsequent advances in only two years. What was seen from 2009-2011 was simply the initial surge higher from the multi-decade 1980 – 2009 consolidation. The retreat since 2011 is thus a correction within what will be a more significant move higher both in time and in price above the former 1980 peak.
Continue reading the full article for free on our partner site Gold Eagle…