Interview on J22 Report
Christopher Aaron was recently interviewed on the J22 Report with John Manfreda. The interview covers precious metals, technical analysis, and the outlook for 2017 and beyond.
https://www.youtube.com/watch?v=ZYWnDbKfo14

Christopher Aaron was recently interviewed on the J22 Report with John Manfreda. The interview covers precious metals, technical analysis, and the outlook for 2017 and beyond.
https://www.youtube.com/watch?v=ZYWnDbKfo14
It is increasingly clear that events beyond the United States borders will play an important role in defining the trends over the next few weeks for the precious metals and currency markets.
Of course, the international perspective is a critical component of the long-term thesis for precious metals throughout this macro cycle. During the 1970’s, when gold rose over 2,000% between President Nixon’s breaking of the Bretton Woods accord in 1971 and its subsequent peak in 1980, the bull market was mostly a US dollar-driven event. Dollar-holders turned in their greenbacks en masse, causing the price of gold to rise.
In contrast, the current backdrop for the metals has the potential to be even more powerful than in the 1970’s precisely because we now see a worldwide case for precious metals ownership.
Click HERE to continue reading the full article for FREE on our partner site, Gold Eagle…
Wednesday April 19, 2017: due to a scheduling conflict, tonight’s regularly scheduled broadcast will not be aired. I will be back in one week with the next broadcast. -Christopher Aaron
Christopher Aaron shares views on the precious metals and gold equities this weekend on the Korelin Economics Report. You may find the show for free by clicking on the links HERE.

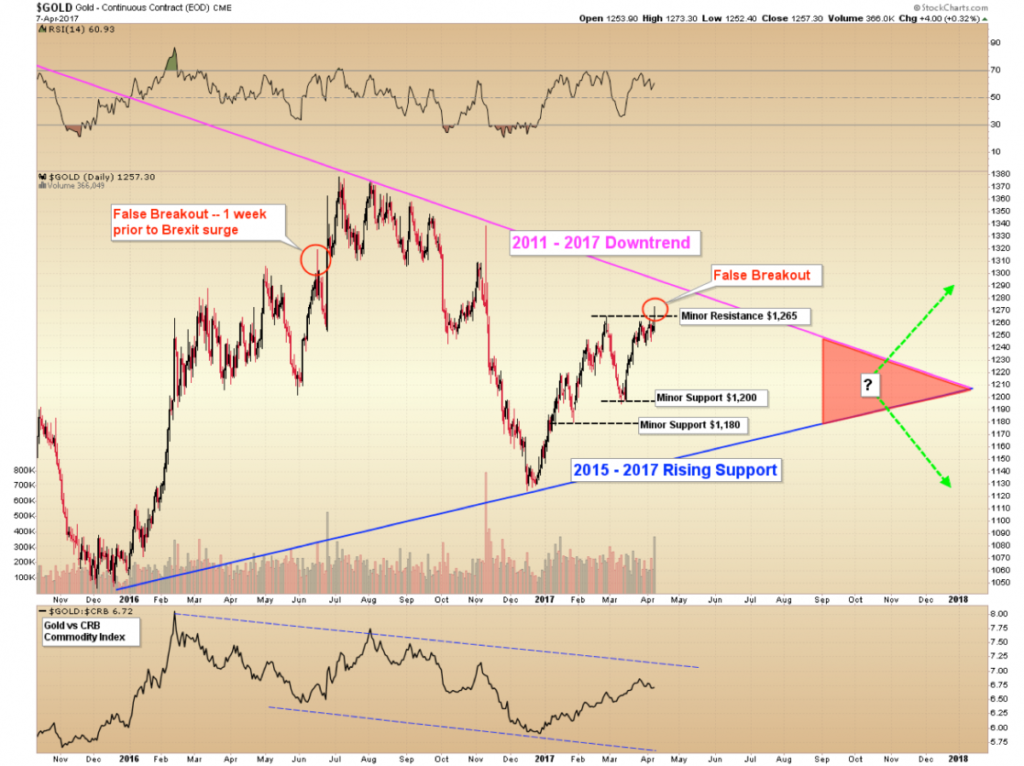
The surge above $1,265 for gold in the wake of the US retaliation against Syria, yet its failure to hold this level by Friday’s close, constitutes a “false breakout” in our technical work. False breakouts occur when an important resistance level is breached momentarily, but then buyers nearly disappear and new sellers show up, causing a reversal bar on the daily price chart.
False breakouts (or their inverse false breakdowns) tend to mark at least short-term reversals. However, the degree and length of the reversal cannot be determined simply from the single day of price action. It would be a mistake to think that all false breakouts portend major trend reversals. Perspective is key.
Click here to continue reading the full article for FREE on our partner site, Gold Eagle…
A recent feature on the Korelin Economics Report, where I discussed with host Corey Fleck the gold market, fundamentals vs. technicals, and ratio analysis for the mining sector: Click HERE to listen on KE Report.
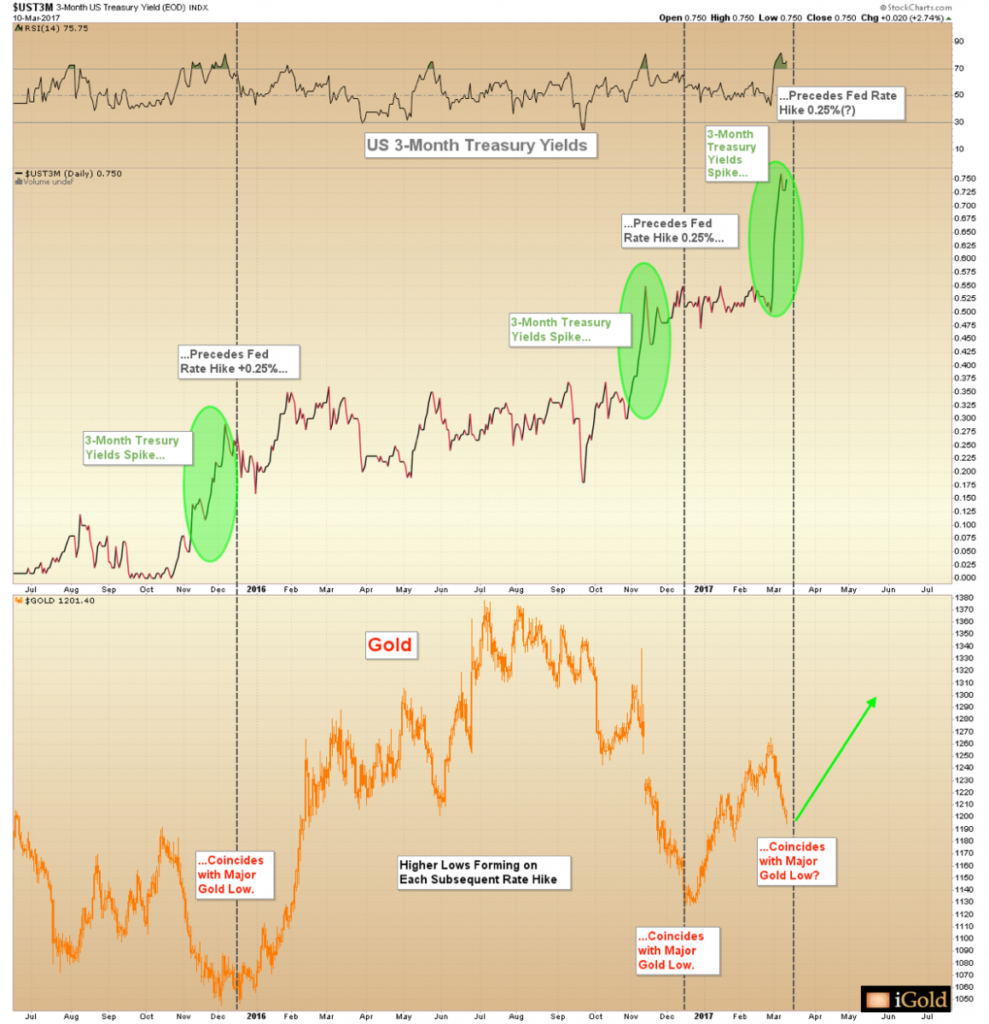
Three-month US Treasury Bills are now pricing in a hike for tomorrow’s interest rate decision by the US central bank. This leading indicator has been highly accurate since the first Federal Reserve Rate hike in December 2015. Below we show a two-part graph, with the 3-month Treasury yield on top, and the price of gold immediately below. Fed ¼ point rate hikes are highlighted by the black vertical lines:
Click here to continue reading the full article for FREE on our partner site, Gold Eagle…
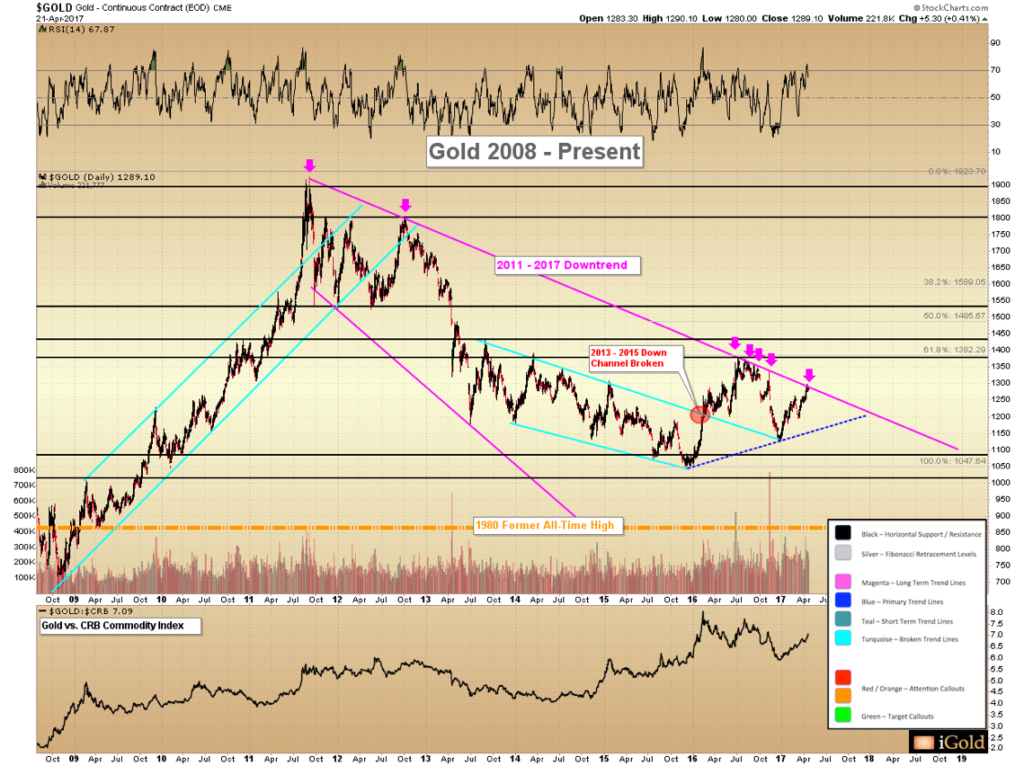
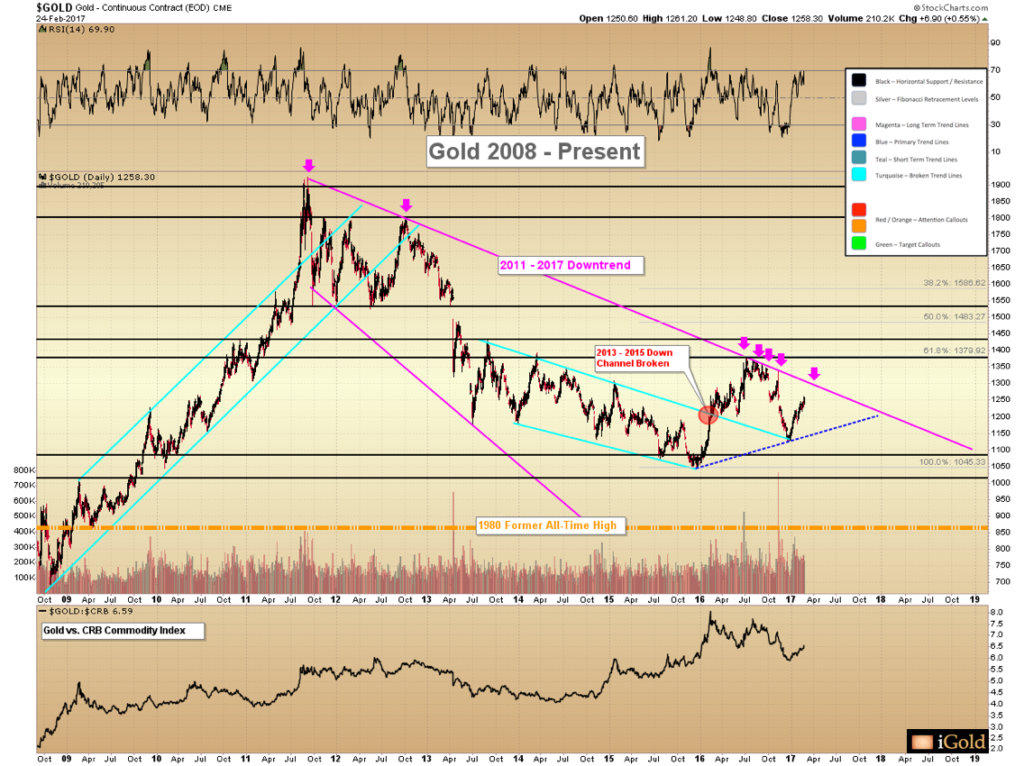
Gold is back to within $40 of the most important technical level we have been watching since 2011: the primary declining trend shown in magenta on the 10-year chart below. The downtrend in question now comes in squarely at $1,300 – so a new test of the trend line could come as soon as this week:
Click here to continue reading the full article for FREE on our partner site, Gold Eagle…
There has been some analysis in the mainstream press recently suggesting that should the dollar fail to hold 100, it could retreat perhaps to 97 – 98 before finding support. While this is true from a short-term basis, as there is a rising (blue) trend line visible on the chart from the May lows, we believe this analysis is largely missing the big picture.
A failure for the dollar to hold its November breakout would constitute an extremely bearish “false breakout” from a 2-year consolidation. The result should be a severe plunge to the downside lasting for several months as an initial wave. The blue trend line shown above would not provide more than a temporary bounce in such a situation. False breakouts following new multi-year highs represent major reversal patterns, quite in contrast to false breakouts from a multi-year bottoms.
Click here to continue reading the full article for FREE on our partner site, Gold Eagle…
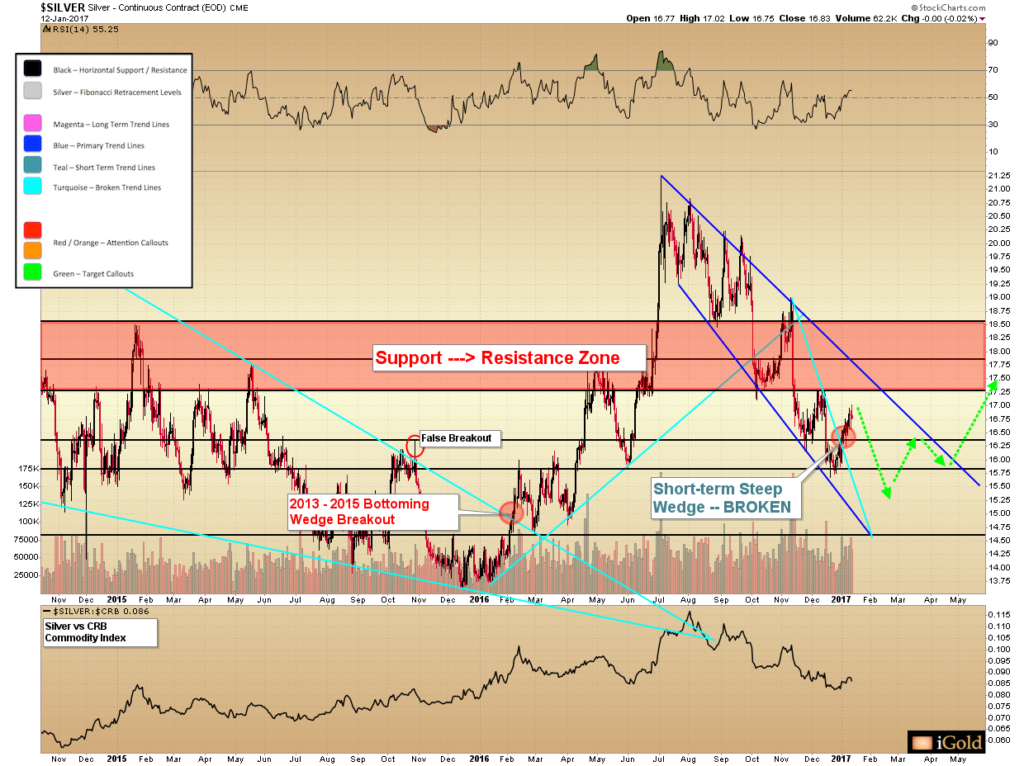
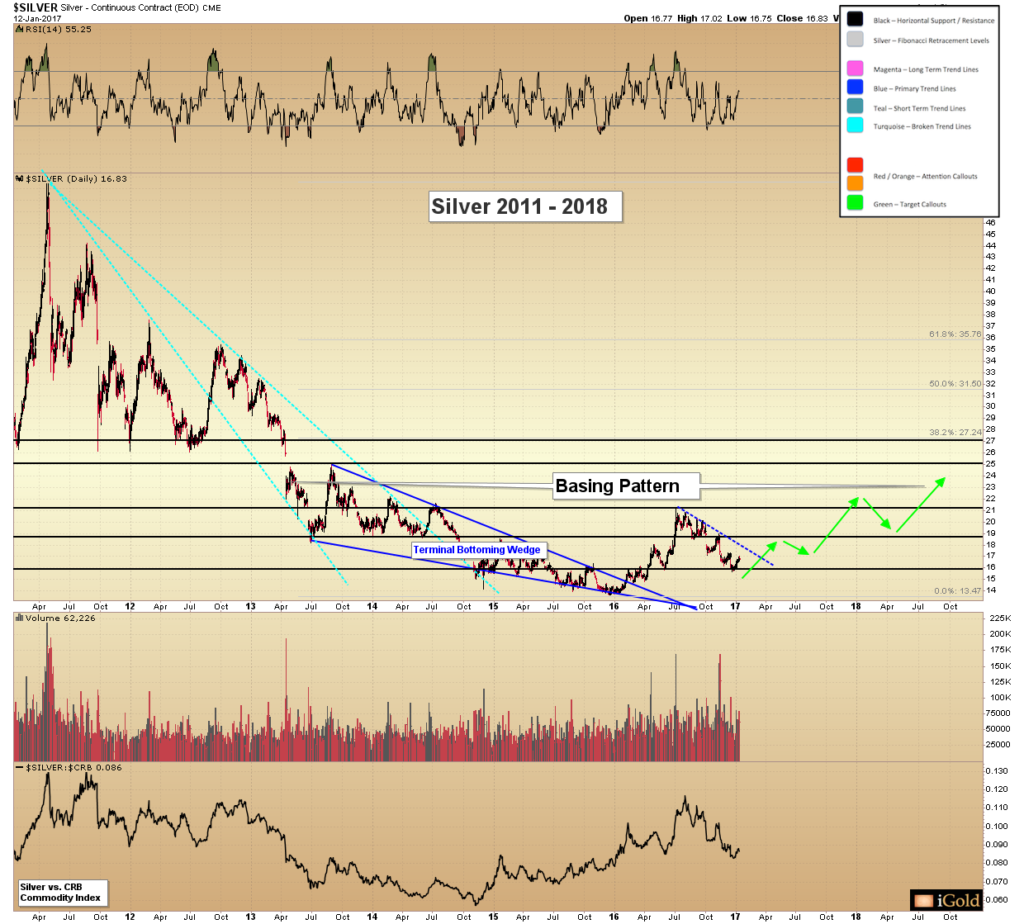
Today we focus closely on the price of silver, and the likelihood for an important low to be forming this spring. Also, an examination of the potential shown by the XAU to silver ratio.
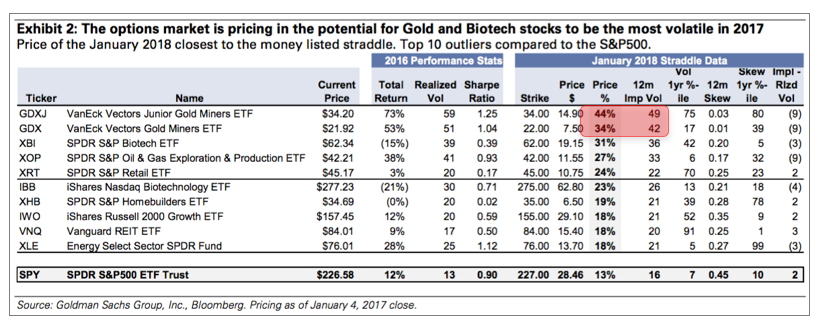
The options market is pricing in that the precious metals equities will be the most volatile sector in the world in 2017. What should investors expect and what are some good strategies for navigating this volatility?
It is important that precious metals investors keep multiple time horizons in perspective as they make their investment decisions. Often the focus is on the day to day gyrations in the prices of silver and gold. Yet it is critical to revisit the longer-term perspective on a regular basis, as the price action currently being seen has the potential to set the silver market on an important course lasting well into the next decade.
Click here to continue reading the full article for FREE on our partner site, Gold Eagle…