Gold and Silver Around the World
Today we look at gold and silver prices around the world for confirming indicators of a new bull market. Currencies include:
-US Dollar
-Canadian Dollar
-British Pound
-Euro
-Australian Dollar
Today we look at gold and silver prices around the world for confirming indicators of a new bull market. Currencies include:
-US Dollar
-Canadian Dollar
-British Pound
-Euro
-Australian Dollar
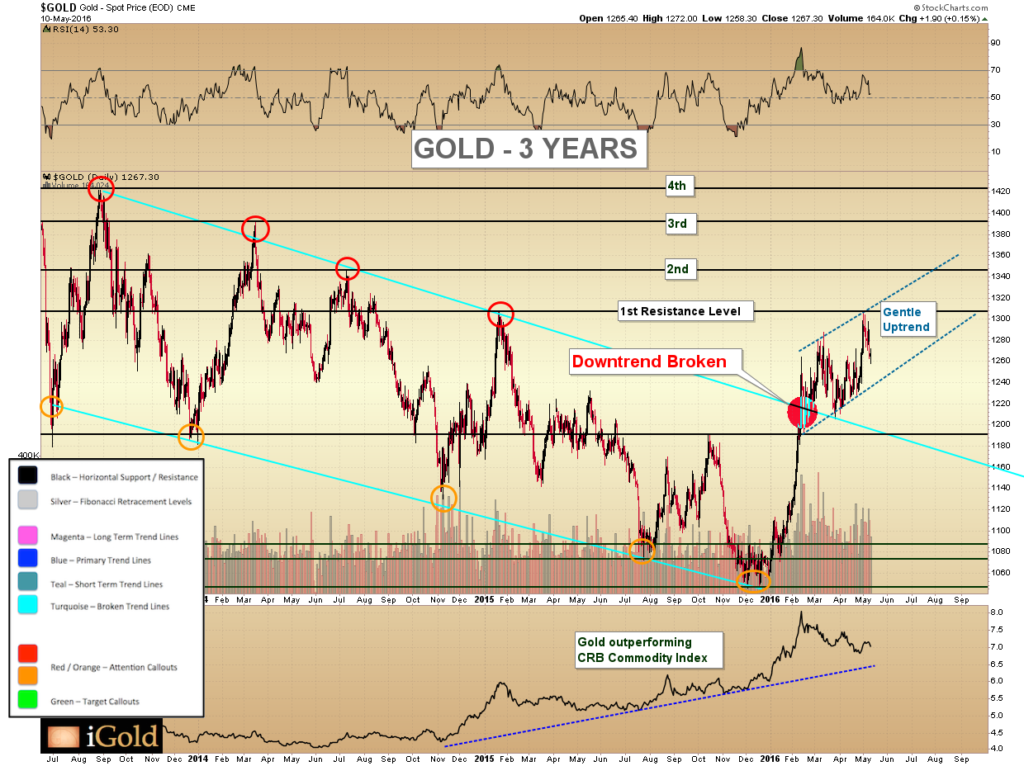
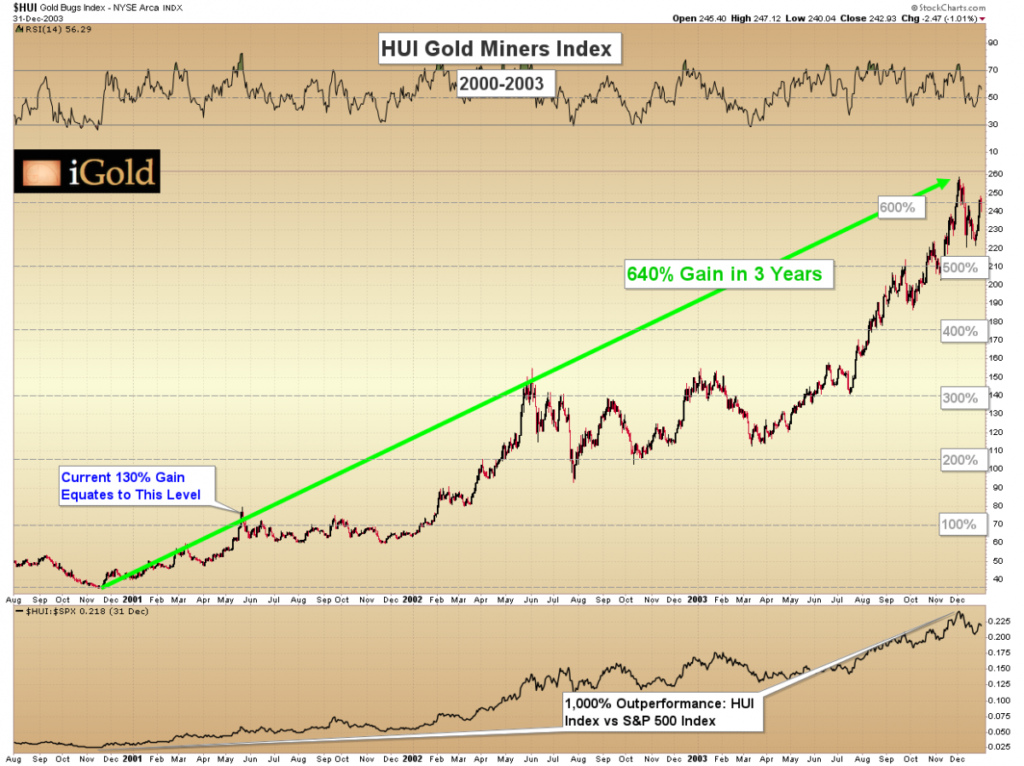
Gold is up nearly 21% from its December 2015 lows. Moreover, silver has added an impressive 28% to its price during the same timeframe. Most notably, the HUI gold and silver mining index is up over 100% during this period.
Despite the strong performance we have seen from the precious metals complex thus far in only the first few months of 2016, many fear that the move is already nearing an end. Readers should be aware that the potential for both gold, silver, and strong mining equities is much greater than the moves seen thus far. Indeed, a review of the metals and several valuation metrics over a longer time frame can provide us with clues as to what we should expect through the later part of this decade.
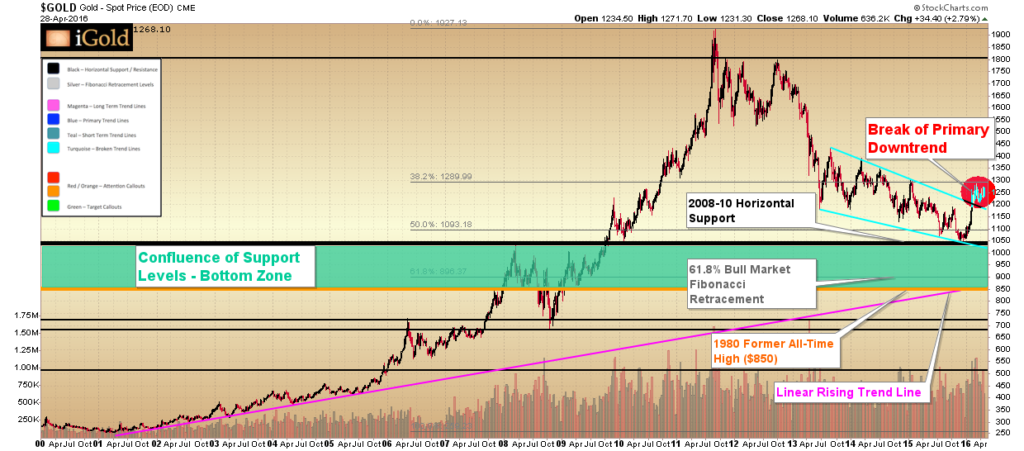
Below we review the long-term perspective for gold since the year 2000. Gold bottomed in 2001 after a nearly 20-year bear market following the peak in 1980 at $850/oz. The return advance to again challenge the $850 level took eight years, although it was not until the following year (2009) that prices decisively broke through this level for good.
Gold then advanced for two years above the former all-time high, hitting $1,917/oz in 2011, before falling back some 45% over the course of nearly five years through the end of 2015.
Markets that consolidate for 29 years (1980 – 2009) below an important peak level ($850) do not finish their subsequent advances in only two years. What was seen from 2009-2011 was simply the initial surge higher from the multi-decade 1980 – 2009 consolidation. The retreat since 2011 is thus a correction within what will be a more significant move higher both in time and in price above the former 1980 peak.
Continue reading the full article for free on our partner site Gold Eagle…
The gold to silver ratio has broken down below an important 5-year trend. What does this mean for silver and gold prices going forward?
Also we look at the formation of a set of embedded head & shoulders patterns in silver that are going to set the stage for significantly higher prices in 2016-17.
Gold continues to consolidate in a very healthy formation.
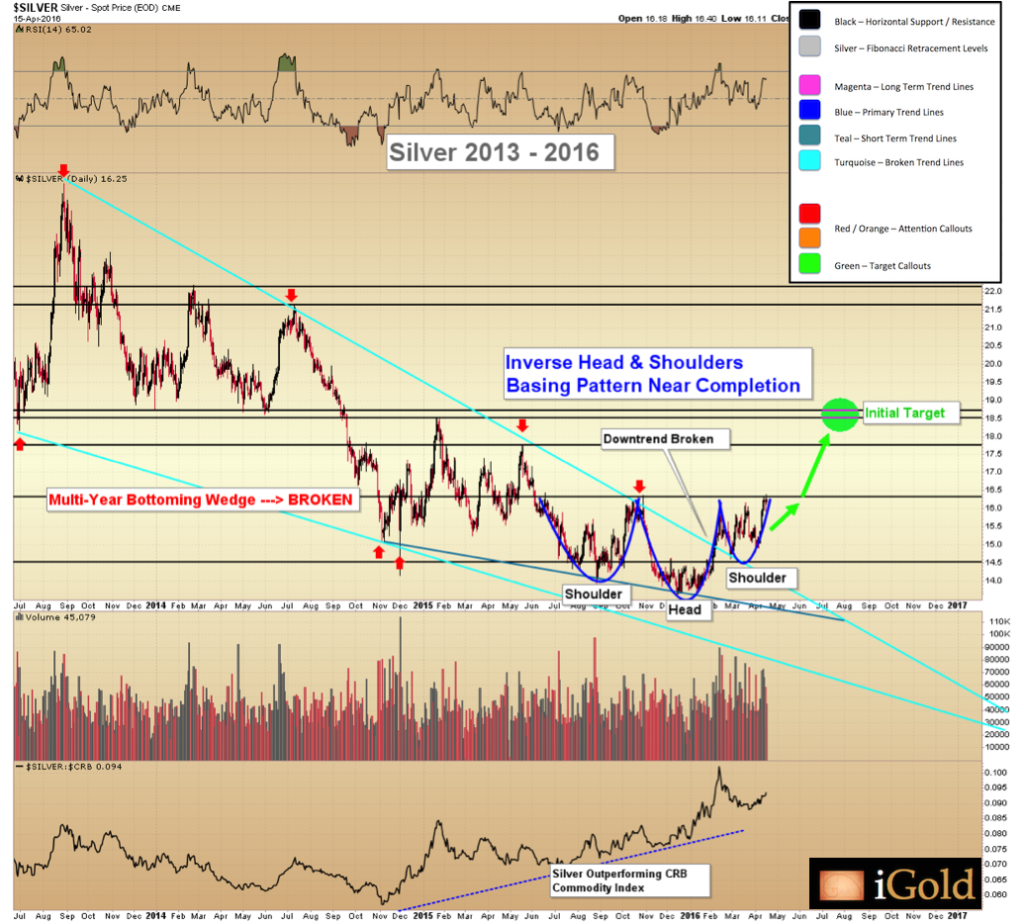
Silver breaks its Inverse Head & Shoulders pattern… what should we look for as the next target?
News out of Reuters on Wednesday has caused quite a stir in the precious metals investment world as a manipulative silver-fixing scheme headed by large multinational banks was revealed. Consequently, many are wondering what the long-term ramifications of the story will be. To bring readers up to speed, we quote briefly below:
Deutsche Bank AG has agreed to settle U.S. litigation over allegations it illegally conspired with Bank of Nova Scotia and HSBC Holdings Plc to fix silver prices at the expense of investors, a court filing on Wednesday showed.
Terms were not disclosed, but the accord will include a monetary payment by the German bank, a letter filed in Manhattan federal court by lawyers for the investors said.
Continue reading the full article for free on our partner site Silver Phoenix……
Today we take an in-depth look at the bottoming pattern showing for the price of silver.
Gold also looks very healthy for the beginning of a trending move higher.
The gold and silver miners are showing excellent leadership in the sector, and we share some research as to the valuation potential for the sector.
Gold is retesting its breakout in the $1,185-1,200 region, while silver is setting up a long-term inverse Head & Shoulders bottom.
Gold and silver have been weak the last few days, so we take a step back to look at where things are on the longer term charts.
It is also important to decide what sort of investor you are. Do you trade the short-term swings, or are you longer-term oriented? In my experience, there is room for both, but they require very different strategies.
When it comes to forecasting gold prices, there seem to be two main types of conclusions being offered by analysts these days:
1) Gold made a long-term top in 2011, is still in a bear market…and will fall to below $700 per ounce.
2) Gold is going to skyrocket this year and see $5,000 or more by 2020.
At our firm, we fall into neither extreme. And while our type of analysis may not catch as many quick headlines, we are going to cover in detail the trajectory we believe gold prices are setting up for a distinct third possibility to the aforementioned hypotheses.
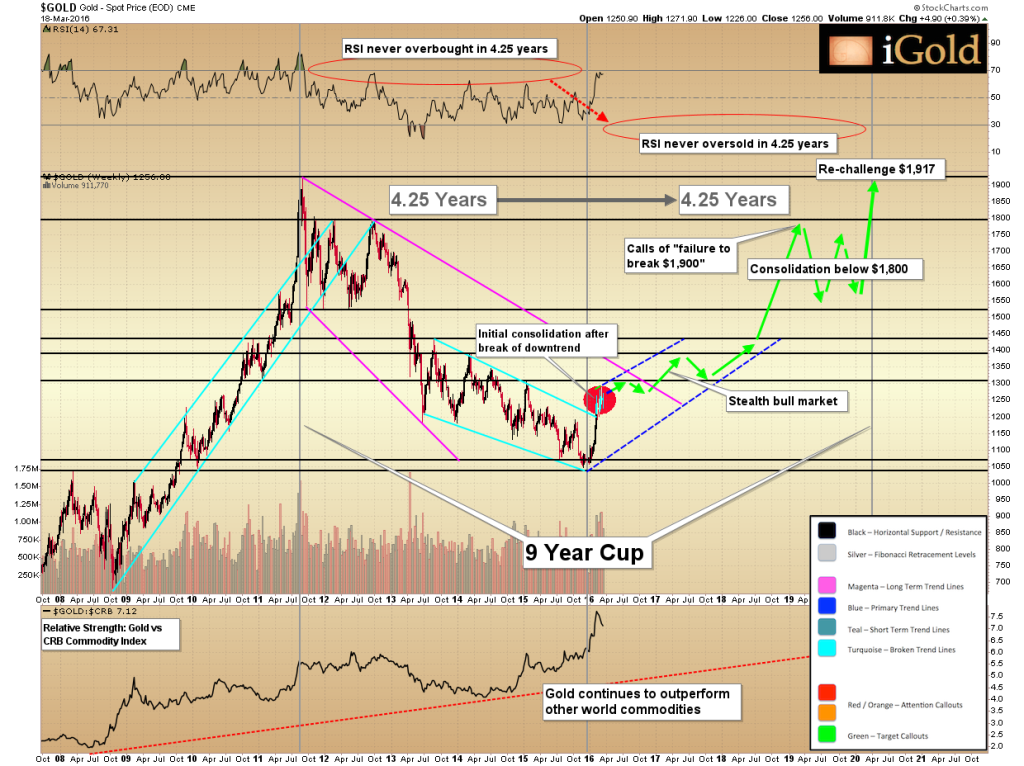
3) Gold prices will climb slowly, steadily and stealthily for the next 4.25 years without a significant pullback, re-challenging $1,900 by 2021.
Continue reading the full article for free on our partner site Gold Eagle…
We are looking at the model for a stealth bull market underway in gold, and watching important resistance levels around $16.25 for silver.
Today we look at historical examples of multi-decade consolidations and breakouts that have occurred in the past in the Dow, from 1959-1982 and what happened afterward.
The gold and silver mining sector as referenced by the XAU has been consolidating now for over 30 years. Its potential is larger than that of the Dow in 1982.
We also look at the corrections that occurred in previous bull markets.
The Fed’s remarks today sent gold blasting higher with silver following not too far behind. Today we put that action into proper context since the first Fed rate hike from December 2015.
Today we look at the last week’s worth of market action for both gold and silver. We have higher targets for silver coming, and gold looks to be in a nicely defined trend channel.
Also some thoughts on the PDAC convention in Toronto.
Gold has a nice break above our consolidation pattern as expected, while silver performs perfect textbook technical action.
Coming to you from Toronto, with an update from the PDAC mining convention coming later this week.
The SLV silver fund has shown its highest hourly volume in 6 months… an important indicator on a retest.
———-
I will be attending the Prospectors and Developers Association of Canada conference, in Toronto from March 6-9. I will have some updates on the gold & silver mining sector from the show.
Link to PDAC gold & silver mining convention in Toronto, Canada, March 6-9: http://www.pdac.ca/convention
Going to be there? Get in touch.
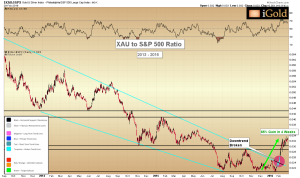
Four weeks ago we alerted readers that the XAU (gold & silver miner) to S&P 500 (US stock market) ratio, standing at 0.02, was the lowest it had ever been in modern history, with data dating back through the 1970’s. In our view, the valuation had become too extreme, and as ratios between real asset classes cannot go to zero, it was time to start looking to position for a reversion to historic norms. Additionally, our technical analysis revealed a pending break of a multi-year primary downtrend channel, as shown by the royal blue color above.
Updating our chart below we can see that the breakout in the mining sector has materialized, as the ratio has broken through the multi-year downtrend and fully cleared the 6-month resistance level at 0.029. This break higher has closed the month at 0.033, a full 65% higher in four weeks. Such would represent an annualized gain of 780%!
Continue reading the full article for free on our partner site Gold Eagle…
Many people have asked how to contribute for this work. If you would like to support this channel, the suggested amount is $2 per month.
The place to do that is here. Simply follow this link and click ‘BECOME PATRON’ and follow the prompts:
https://www.patreon.com/user?u=2939471&u=2939471&ty=h
With these funds, I anticipate to add significant new depth to this channel. If you cannot afford $2 or do not find value in this analysis, you may continue to watch for free.
Thank you for all your support.
———-
There has been a lot of concern about silver prices in the last few days, struggling even as gold has held above a critical support zone. Today we look at the long-term data driven trajectory models for both gold and silver, extending our predictions out into the year 2021.
While silver has been weak recently, there are many early warning indicator signals coming that this weakness is only temporary.
Meanwhile, gold is showing signs of repeating the 1970’s model but on a longer-scale timeframe.
Thank you for watching.
-Christopher Aaron
It is important to be motivated to do the work that is required to achieve outstanding gains in this sector, so today we look at the two most important valuation metrics for gold and silver:
A) gold & silver miners vs. the rest of the US economy
B) gold & silver miners vs their own metals (gold & silver)
There is a precedent for life-altering gains in this sector currently, based on data-driven valuation metrics.
I believe in this research, which is why I am sharing it here. This is the research I use personally, and for clients. Thank you for watching.
Very healthy consolidations are occurring in the gold and silver markets at present. And we have early warning indicators to the near-term price trends…
Currently we are working on a detailed model for the price of gold over the next several years. That should be available in the next update.
Thank you for watching.
The price action for both gold and silver continues to show bullish implications for the establishment of the long-term lows we have been watching for the last several months. What we are seeing now are bullish consolidation patterns, which are very healthy for markets that have had recent strong rises. We are watching several critical support areas for these consolidations, the holding of which would set the precious metals up to begin a trending move to the upside through the later part of this year and into 2017.
Continue reading the full article for free on our partner site Gold Eagle…
Gold continues to consolidate above the October high, while silver’s bottoming breakout becomes more legitimate by the day. Why is the gold/silver ratio still moving in favor of gold?
Link to Mike Maloney’s analysis, as it is always beneficial to hear different perspectives:
Silver continues to hold a break above our bottoming wedge pattern… how low can it go without negating this breakout?
Gold has hit the lower range of our expected fall — what price do we want to see for gold prices to confirm a new uptrend?
Gold made a significant breakout this week. Can we confirm or deny this move based on gold priced in other currencies?
Also a look at one of the most famous attempts to suppress the price of gold, and how that ended for the Central Banks. Neither gold nor any market can be held back over the long run, and we are getting strong signals now that a new era of rising prices is commencing in front of our eyes.
Thank you for watching.
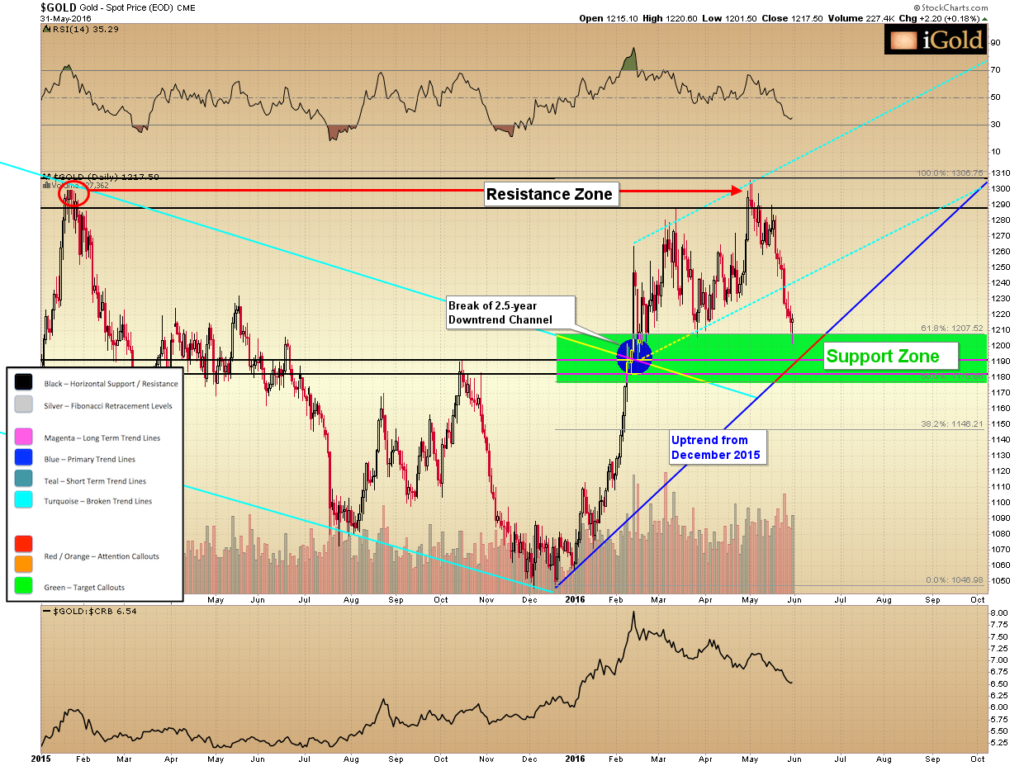
The precious metals are at critical junctures that will mark the final lows for the bear market since 2011. The surge in gold during the New Year has been impressive, with prices rising from $1,045 per ounce to hit $1,200 as this article goes to press, a gain of 15%. Has the final low been put into place?
Gold’s Key Resistance Level
We back our charts out to a 15-year timeframe to view the current action in proper context. Below we can see the rise in gold from 2001 through the peak in 2011, followed by the current bear market. Since early 2013, the downward moves have been defined primarily by a clear series of waves contained within a linear downtrend channel as shown in blue.
Continue reading the full article for free on our partner site Gold Eagle…
The levels that gold and silver need to break to confirm their long-term bottoms are very clearly defined on our medium-term charts, and today we look at those signals.
Also, the mining sector is showing a strong early warning indicator that a bottom is close at hand.