
Author: Christopher Aaron
US Dollar On the Edge of Oblivion
Interview with SD Bullion
Thanks to James Henry Anderson for hosting the weekly metals wrap at SD Bullion:
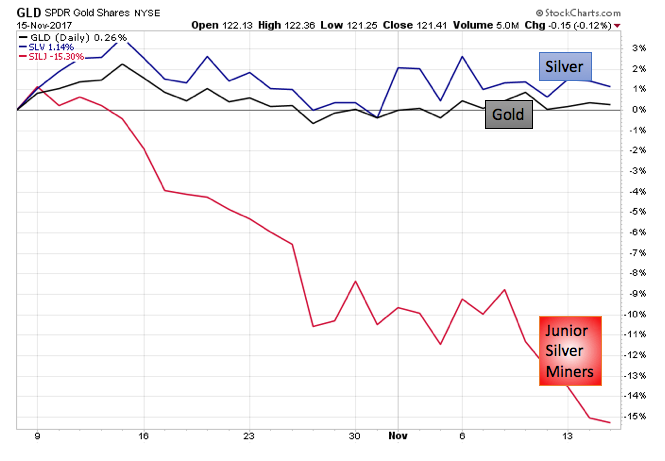
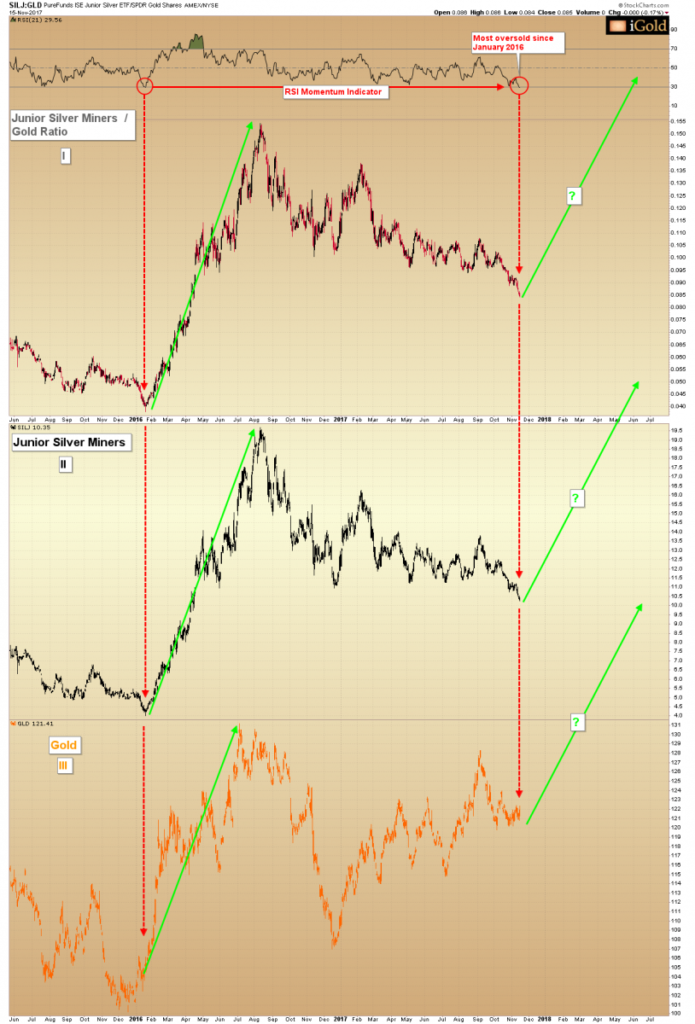
Junior Silver Miners Hint Of Major Gold Price Low
There is a sentiment indicator that exists in the precious metals world that can help us to find high-probability setups for major lows in the gold price – and it comes from the least likely of places: the junior silver mining sector.
Click here to continue reading for FREE on our partner site, Silver Phoenix…
A Second Look at Gold – Interview with Francis Hunt
SPECIAL PROMO for YouTube listeners – to sign up for any of Francis Hunt’s technical courses, use this link:
https://jd306.isrefer.com/go/tms/IGoldAdvisor/
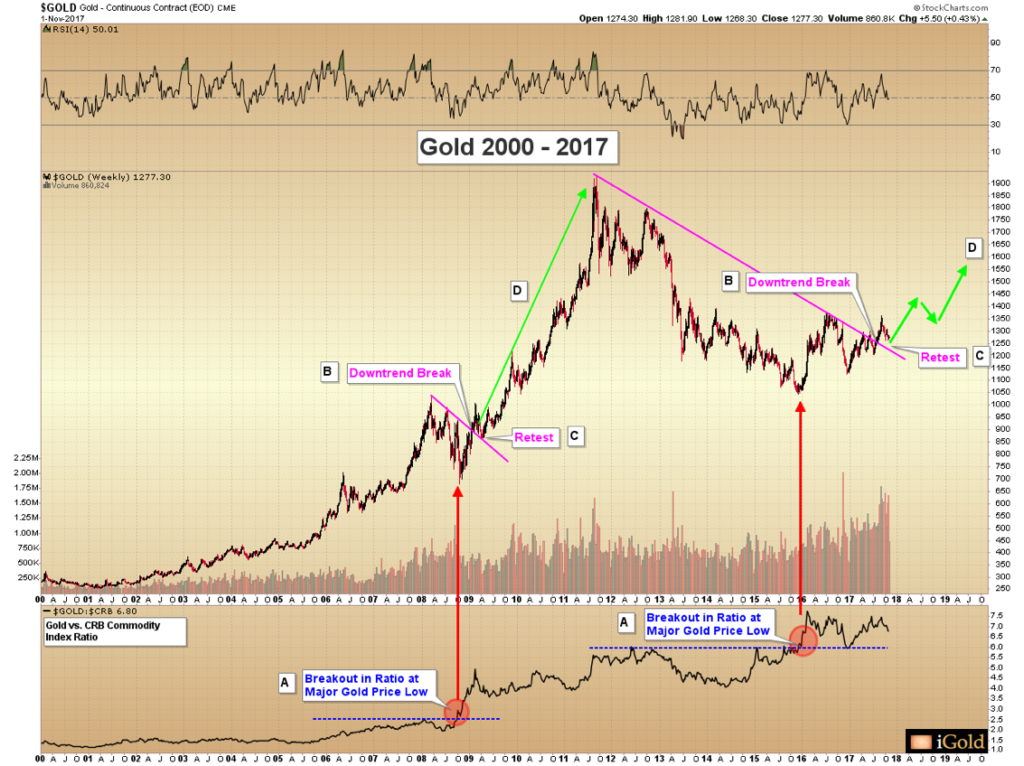
Gold Price Forecast – First Breakout Signal Since 2008
As President Trump prepares to nominate a new chair for the Federal Reserve this week, gold prices remain in a range bound consolidation. Not only has this grinding pattern been ongoing for the last several weeks, but when we examine the price chart for the last five years, we see that gold has essentially been flat as a net sum dating back to mid-2013. And indeed, to the mainstream investor who is primarily involved in a stock market now at all-time highs, gold appears of little interest at the present moment:
Click here to continue reading for FREE on our partner site, Gold Eagle…
Gold & Silver Price Update + A Lesson from History
*VIDEO* 2017 10 30 iGold Precious Metals Intelligence 089 M
Gold Retest
Gold Game Changer?
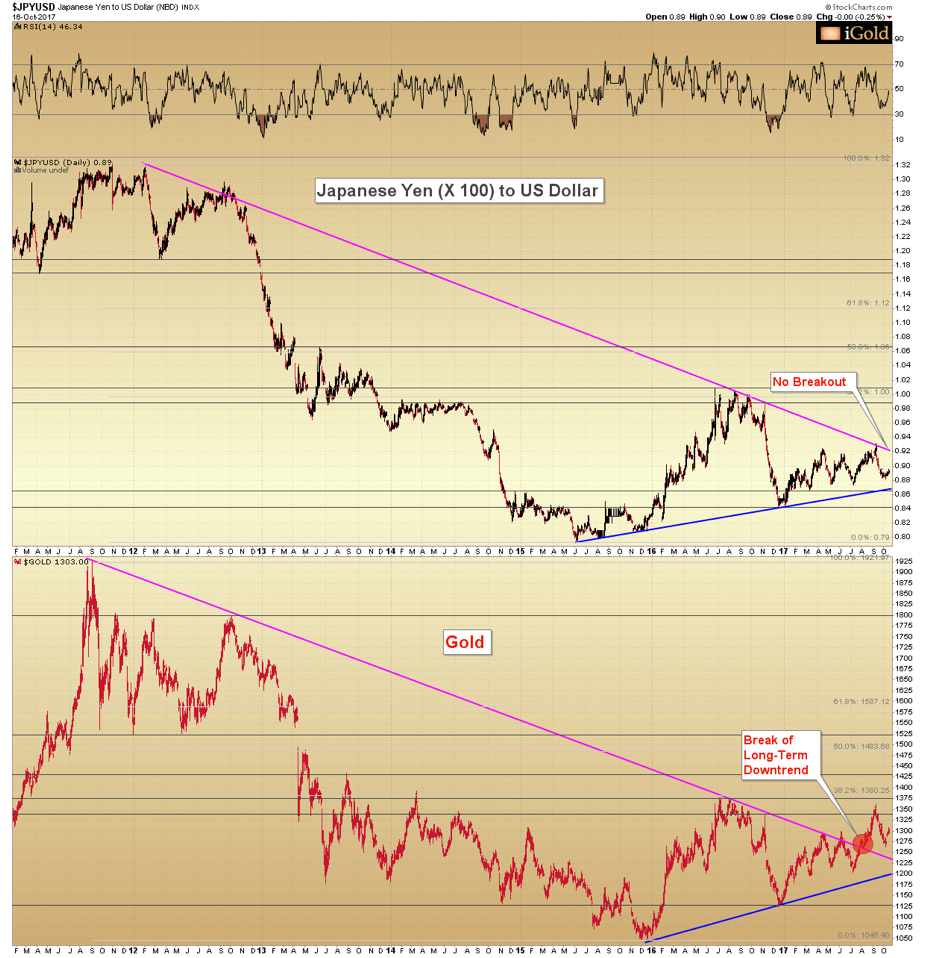
Watch the Gold / Yen Correlation
Both gold and Japanese yen have acted as the same asset class for practical purposes since 2011. However, early signals show gold beginning to outpace yen. Investors should not underestimate the impact that a more significant breakdown in this ratio will have on gold prices. We expect a major gold advance to coincide with a break of the lower boundary of the correlation.
Click here to continue reading for FREE on our partner site, Gold Eagle…
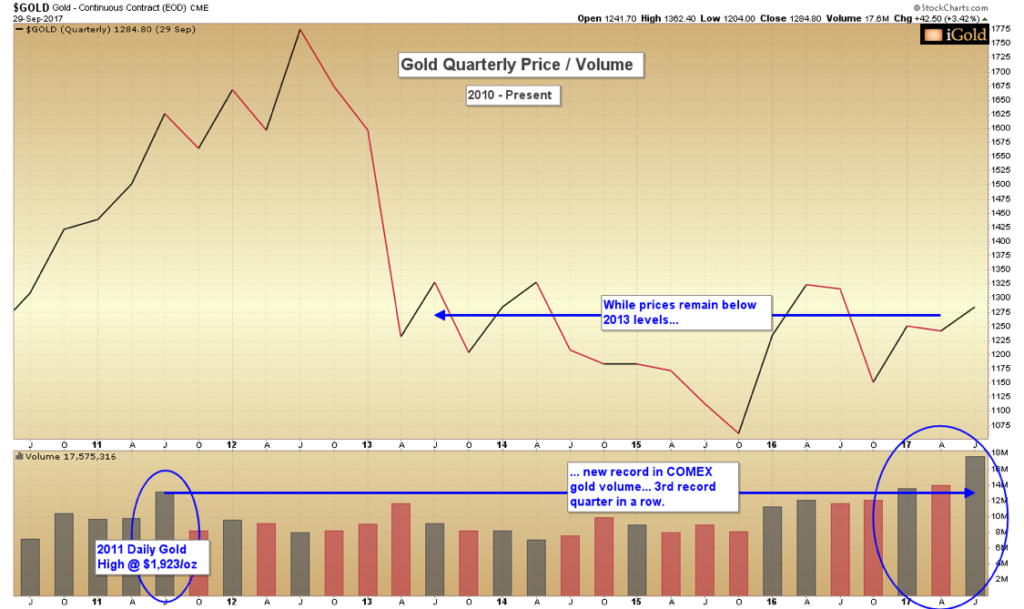
Gold Record High Volume
Gold Prices: Record-Breaking Volume
It is often said that in market analysis: “volume precedes price movement.”
Gold has just posted its highest quarterly volume of all-time for futures trading history, for the quarter ended September 30. The closing data shows that for the period, over 17.5 million contracts traded hands. This eclipsed the previous record volume by a whopping 3.5 million contracts. What’s more, the new record surpasses the number of contracts that were traded during the quarter in which gold made its all-time price high of $1,923 per ounce, which came in Q3 of 2011.
Something is happening here in the gold market, for those who would pay attention to the hints now presenting themselves.
Click here to continue reading for FREE on our partner site, Gold Eagle…
What Happens to Gold Miners in a Stock Market Crash?
*VIDEO* 2017 09 25 iGold Precious Metals Intelligence 084 M
Federal Reserve Smashes Gold
Gold & Silver Near-Term Forecasts
Gold is retesting its 2016 – 2017 consolidation breakout, and the decline seen over the previous two weeks provides an ideal opportunity for precious metals investors to make final purchases before the technical model suggests that 2016 highs will be exceeded for good.
Click here to continue reading for FREE on our partner site, Gold Eagle…

Is Gold Heading Lower?
*VIDEO* 2017 09 11 iGold Precious Metals Intelligence 082 W
The Most Important Gold Indicator
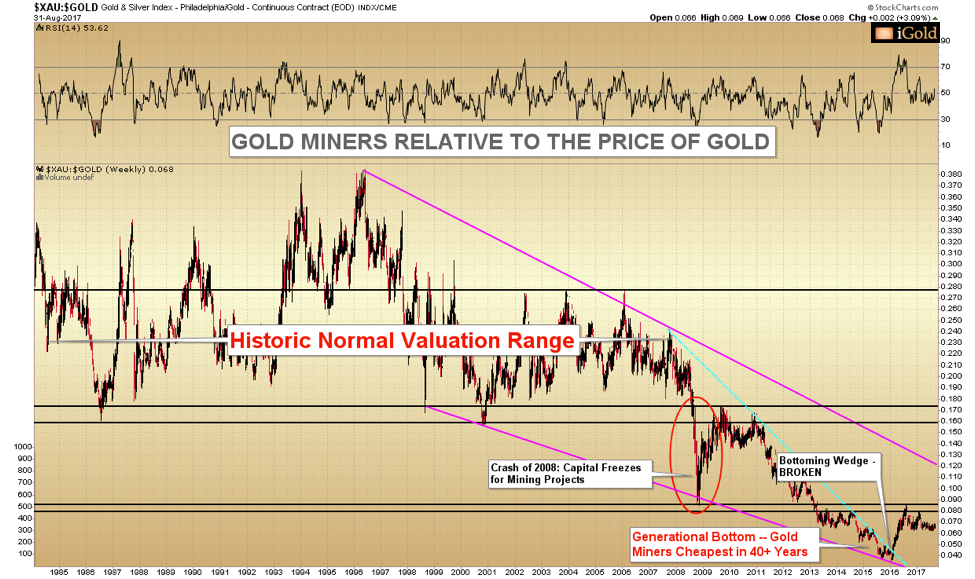
As Gold Breaks Out, Miners Remain Historically Undervalued
While ownership of physical gold should be the cornerstone of a precious metals portfolio, we are overweight the miners at this juncture. Despite gains of 100% – 500% in 2016, the gold mining sector is still historically undervalued relative to gold.
Throughout history, ratios between real asset classes revert to the mean when they become radically undervalued, and this time will prove no different. For those contrarian-minded investors who have a higher tolerance for reward and risk than the above targets for gold bullion alone would provide, the opportunities in the gold producing equities are quite significant.
Click here to continue reading for FREE on our partner site, Gold Eagle…
Gold Breaks $1,300 But Silver Lags
*VIDEO* 2017 08 28 iGold Precious Metals Intelligence 080 M
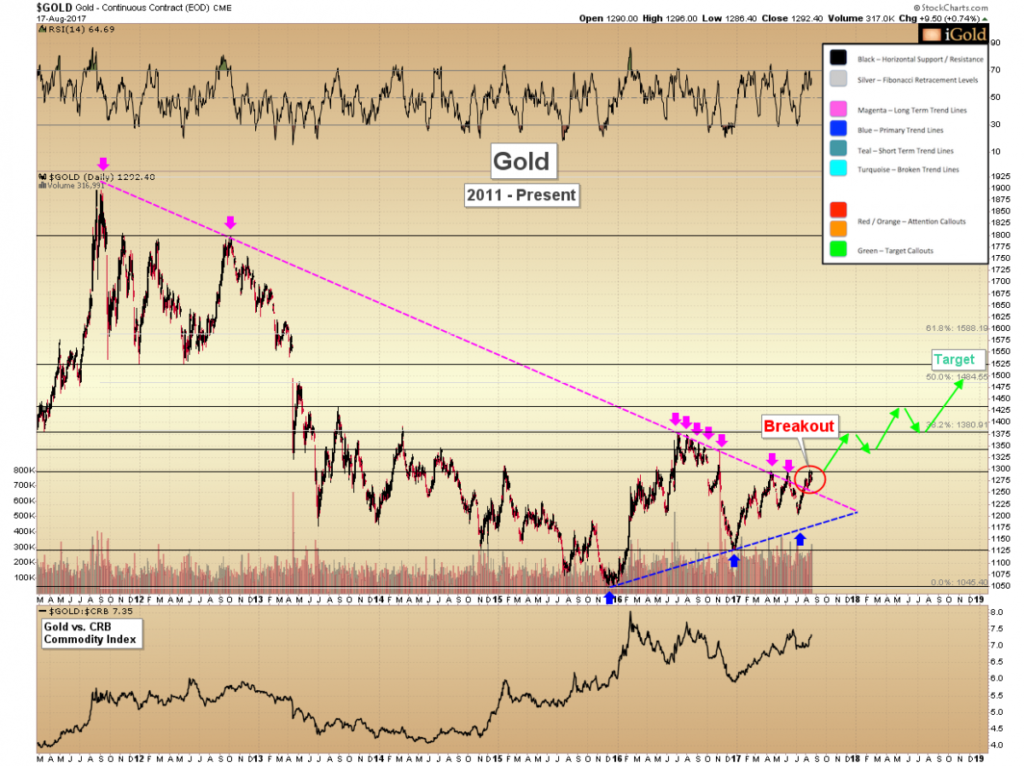
Specific Price Targets for Gold’s Breakout
Gold has finally broken out of a simple yet powerful technical boundary – the declining linear trendline which defined the 2011 – 2017 period in precious metals prices. The ramifications for this breakout are significant and we expect higher gold prices are in store for the next year at minimum.
Click here to continue reading for FREE on our partner site, Gold Eagle…
Gold Breaking Out as Miners Still Historically Undervalued