Silver Breaks Primary Downtrend

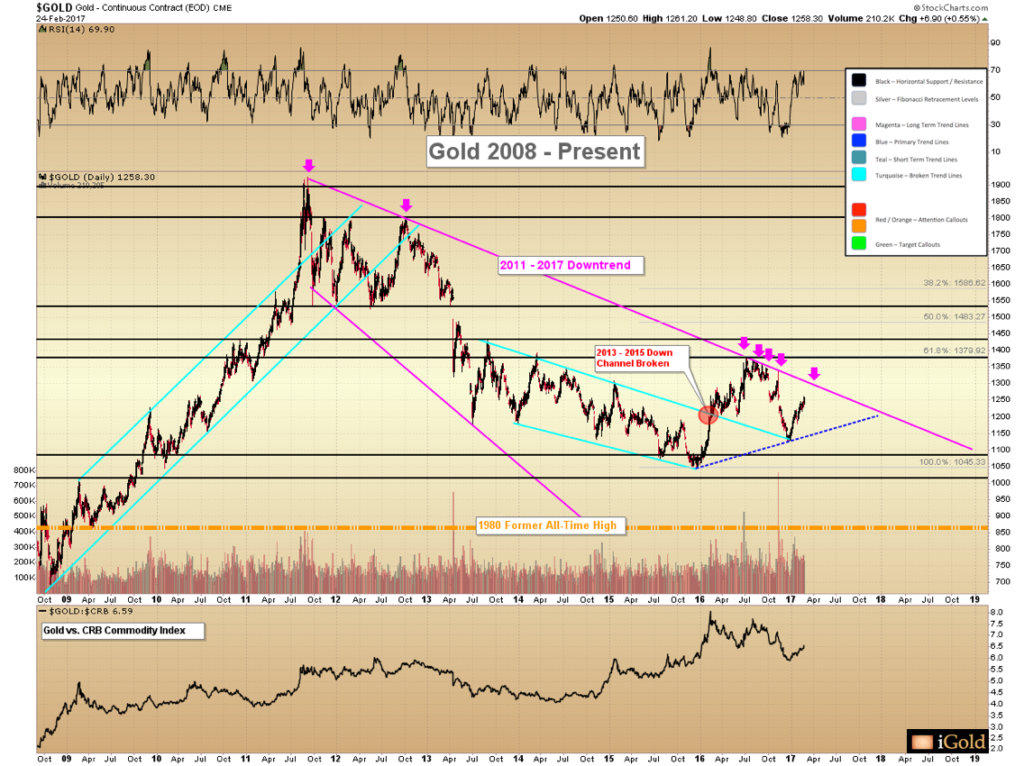
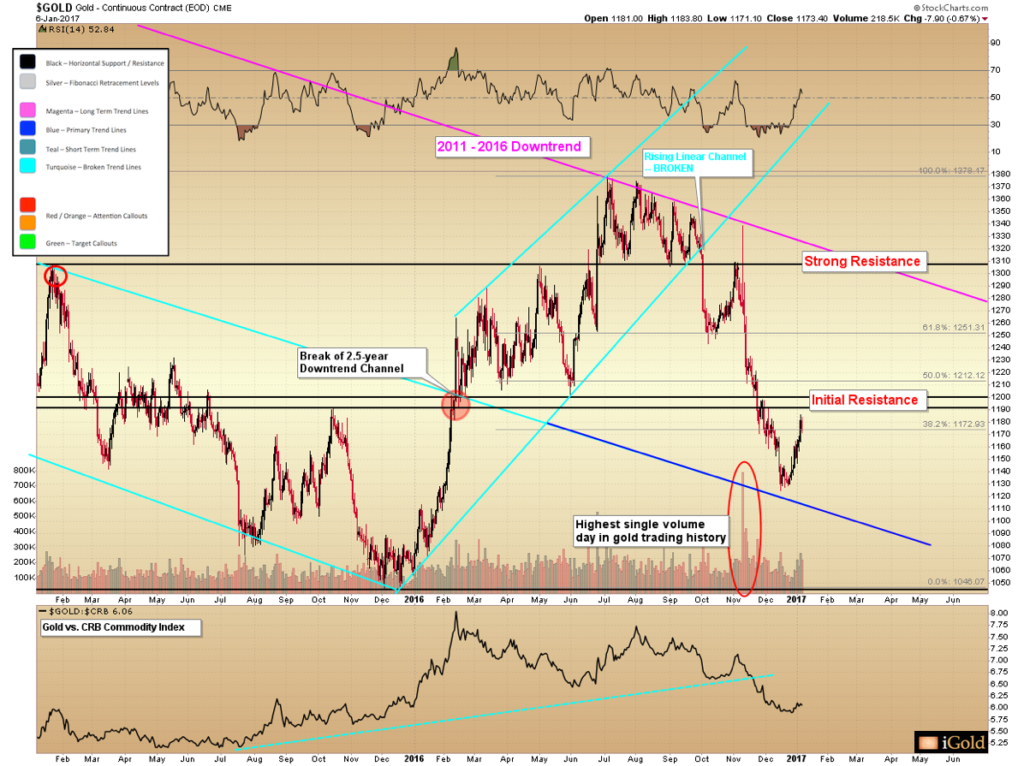
Gold is back to within $40 of the most important technical level we have been watching since 2011: the primary declining trend shown in magenta on the 10-year chart below. The downtrend in question now comes in squarely at $1,300 – so a new test of the trend line could come as soon as this week:
Click here to continue reading the full article for FREE on our partner site, Gold Eagle…
There has been some analysis in the mainstream press recently suggesting that should the dollar fail to hold 100, it could retreat perhaps to 97 – 98 before finding support. While this is true from a short-term basis, as there is a rising (blue) trend line visible on the chart from the May lows, we believe this analysis is largely missing the big picture.
A failure for the dollar to hold its November breakout would constitute an extremely bearish “false breakout” from a 2-year consolidation. The result should be a severe plunge to the downside lasting for several months as an initial wave. The blue trend line shown above would not provide more than a temporary bounce in such a situation. False breakouts following new multi-year highs represent major reversal patterns, quite in contrast to false breakouts from a multi-year bottoms.
Click here to continue reading the full article for FREE on our partner site, Gold Eagle…

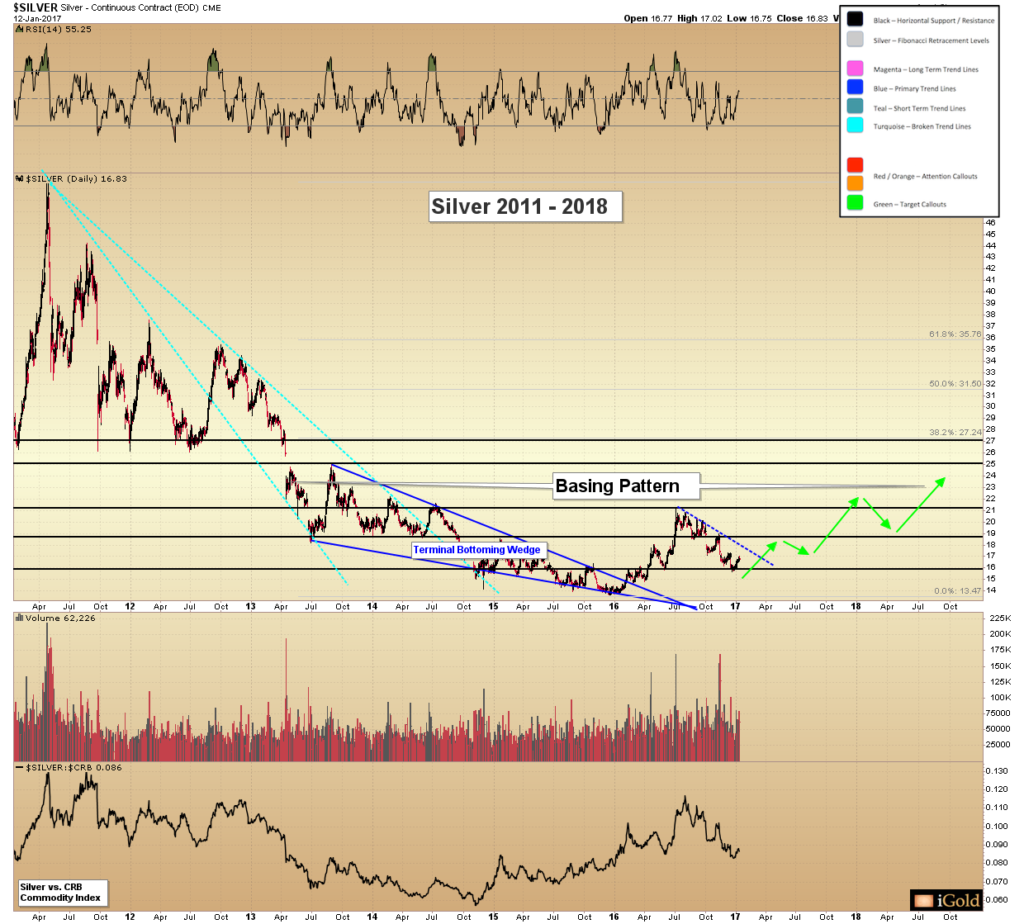
Today we focus closely on the price of silver, and the likelihood for an important low to be forming this spring. Also, an examination of the potential shown by the XAU to silver ratio.
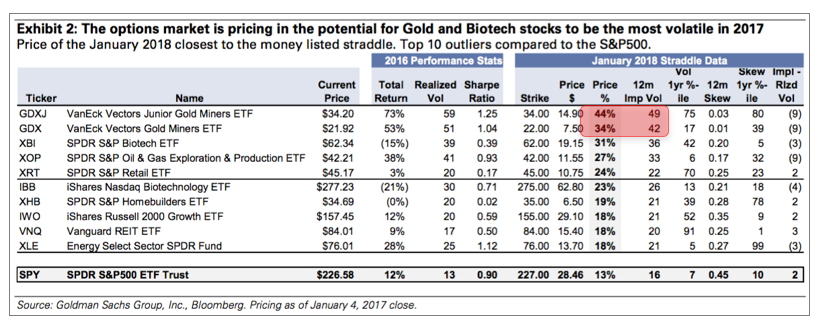
The options market is pricing in that the precious metals equities will be the most volatile sector in the world in 2017. What should investors expect and what are some good strategies for navigating this volatility?
It is important that precious metals investors keep multiple time horizons in perspective as they make their investment decisions. Often the focus is on the day to day gyrations in the prices of silver and gold. Yet it is critical to revisit the longer-term perspective on a regular basis, as the price action currently being seen has the potential to set the silver market on an important course lasting well into the next decade.
Click here to continue reading the full article for FREE on our partner site, Gold Eagle…
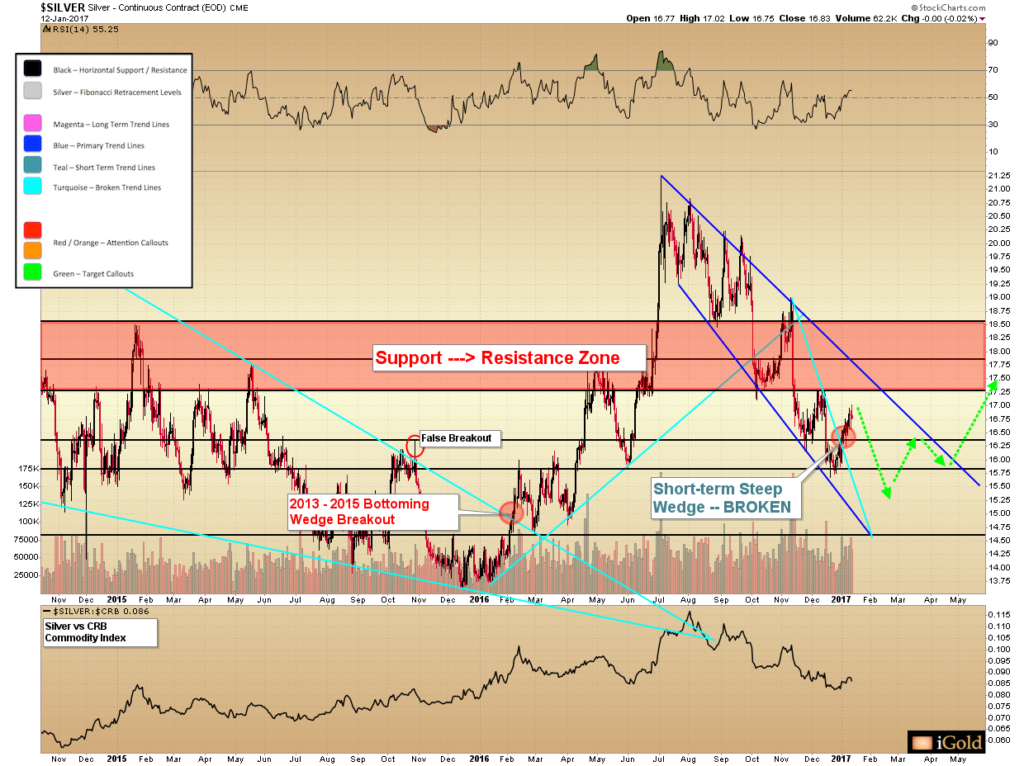
Gold’s behavior near the $1,190 – $1,200 resistance level this week will be telling and thus important to watch. Broken support should act as resistance on the next advance. In plain English, what we are saying is that since buyers failed to show up at $1,200 last November in the wake of the post-Trump sell-off, all else being equal we would expect them to be absent this week when the price tests that level again.
If the gold price backs off in this resistance region as we expect it to, it will indicate a market that is set to spend the next few months range-bound between $1,200 and $1,115, with the possibility of grinding lower toward the 2015 lows near $1,045.
However, should the market disregard the $1,200 resistance and continue higher over the next 1-2 weeks, it will indicate that an entirely new class of buyers has emerged. Effectively, it would mean a different set of buyers are filling in for those absent last November.
Watching gold as it approaches $1,200 will thus be an important indicator for the remainder of 2017. A strong advance through this level will be telling us that the long-term 2011-2016 (magenta color) downtrend will not represent as significant of a challenge on the next attempt as it did during the multiple attempts of 2016: a new set of buyers will have entered the market to support prices.
Click here to continue reading the full article for FREE on our partner site, Gold Eagle…
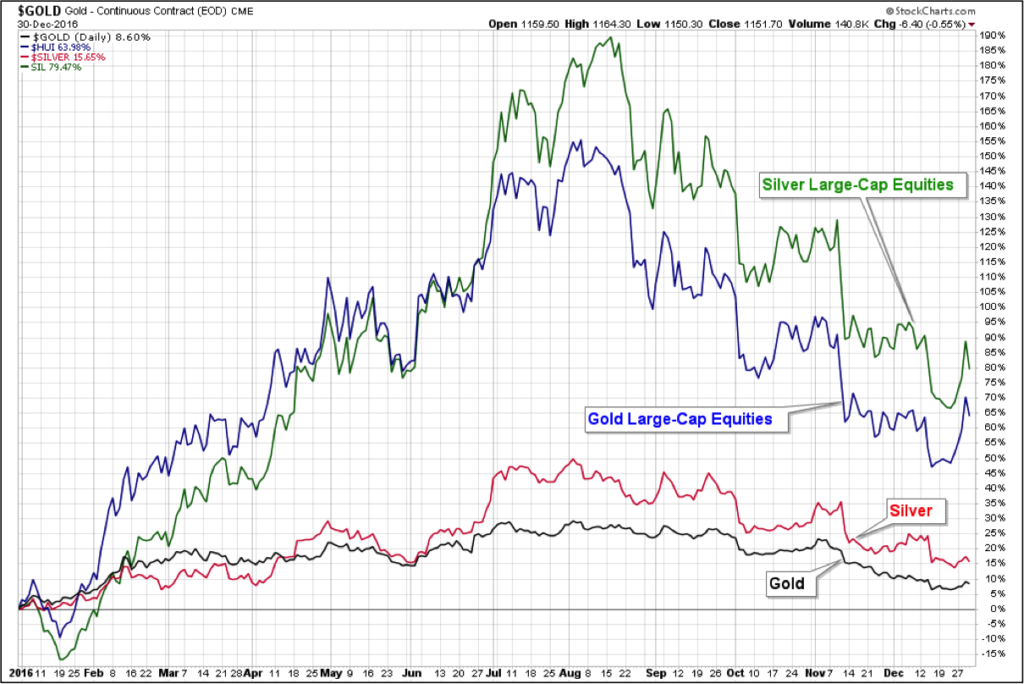
With 2017 upon us and another year in the record books, let us examine the performance of the precious metals in relation to other major asset classes for the full year in an attempt to learn what 2017 may have in store. We begin the article with a broad examination of world assets and then narrow our focus toward gold, silver, and the related mining equities.
Click here to continue reading the full article for FREE on our partner site, Gold Eagle…
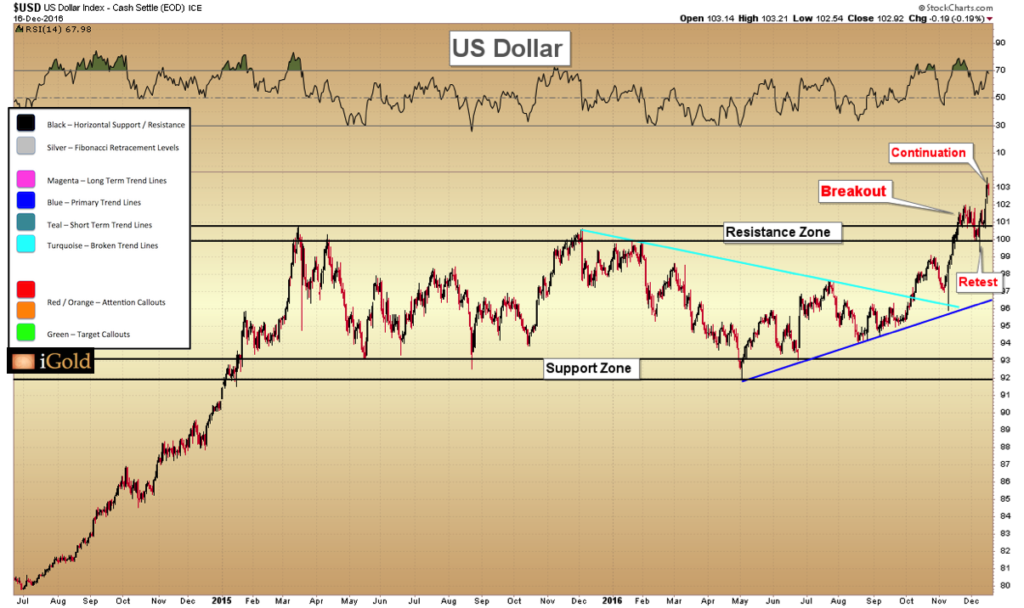
The US dollar took the opportunity of the Fed rate hike last week to advance further from the developing breakout we were observing over the past month. The dollar surged over 1% after the hike, eclipsing the 102 level on the Dollar Index and finally closing near 103 by Friday.
The breakout looks successful, and we now have an intermediate-term target for the dollar at 108 on the Index.
Gold and the precious metals are expected to be under pressure through the remainder of the dollar’s advance toward 108, although it is not true that the two must move opposite the entire time: there are distinct episodes in which the dollar and gold will move in the same direction. So while we will remain cautious on the precious metals until the dollar approaches its intermediate target, it is likely that gold will attempt to establish its intermediate low before the dollar reaches its expected peak.
We are now within five points of the dollar intermediate target… and as, for example, the previous five points from 98 to 103 were gained in just six weeks, the next low for gold could roughly be expected to form within a similar timeframe.
Click here to continue reading the full article for FREE on our partner site, Gold Eagle…
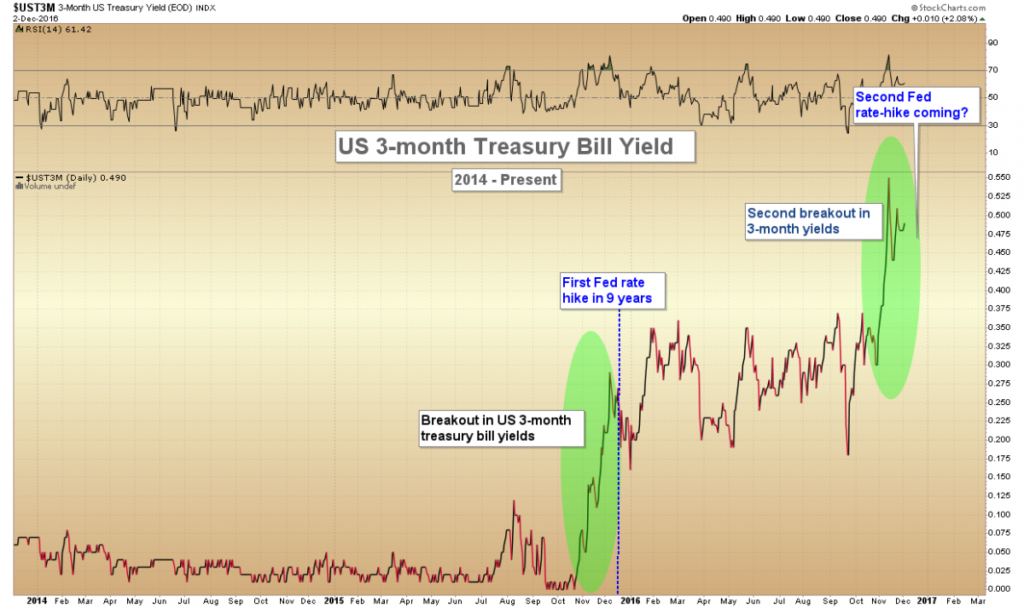
The next Federal Reserve policy meeting is not until December 14. Nonetheless, the US 3-Month Treasury Bill market is already pricing in a hike to the key interbank lending rate.
Why is this important for precious metals investors? Because it was the first Fed Rate hike in nearly a decade last December that marked major turning points in several interrelated markets, including the 2015 bottom in gold and silver prices.
The graph below shows the 3-Month Treasury Yield since 2014.
Click here to continue reading the full article for FREE on our partner site, Gold Eagle…
In the aftermath of the unexpected Trump victory, there is a warning signal showing up in the precious metals markets that investors should be aware of. Despite fundamentals that seem to be supportive for gold, the market may be headed for a retest of the December 2015 low of $1,045, or even lower within the next 3-6 months.
While we remain bullish on precious metals over the long run for fundamental reasons – historic low interest rates, central bank inflation policies, unsustainable debt levels, and unwinnable international wars – we are very keenly aware that these fundamentals do not dictate that prices of precious metals must rise.
For example, these same fundamentals were true from 2011 – 2015, yet gold lost over 45% of its value with silver losing 65% over the same timeframe. Those who clung to their fundamental beliefs, that the above factors would cause the precious metals to rise, suffered serious losses.
The truth is that markets do not move based on fundamentals over the short or medium-term. Yes, over many decades, gold will retain its value, but over periods less than two decades the incredible swings in the price for gold is caused by the psychology of the market, rather than any specific fundamental.
As investors, we must pay attention to what the market is actually doing, and not what we want it to be doing, if we want to succeed.
To do otherwise is a recipe for disaster.
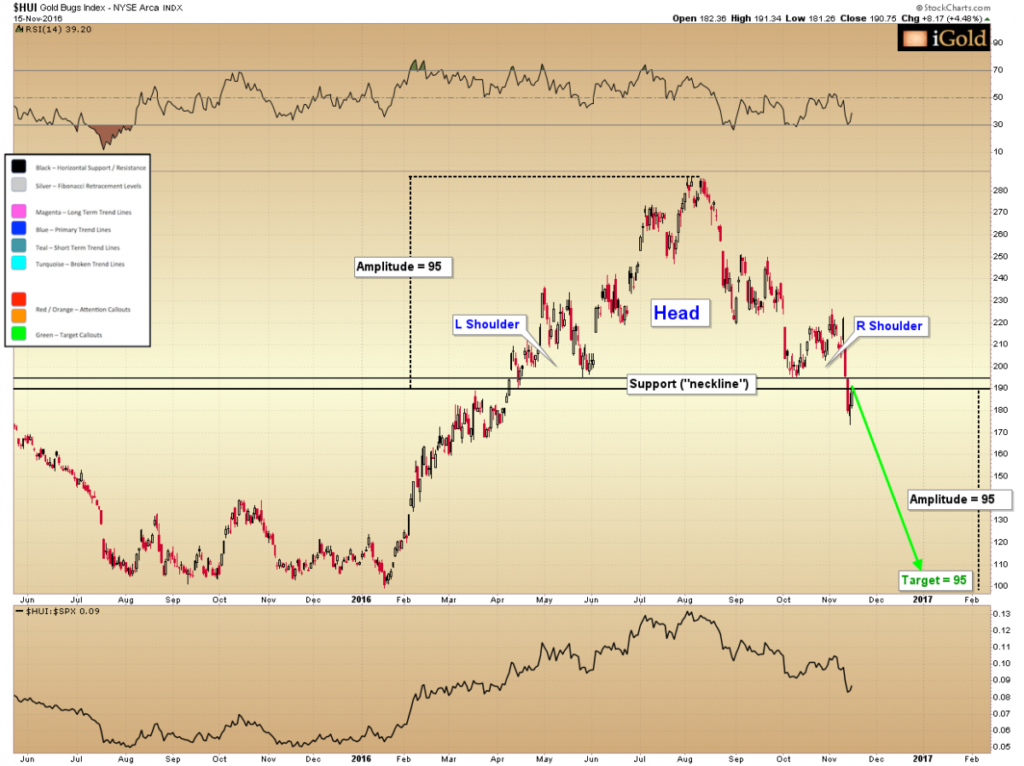
Click here to continue reading the full article for FREE on our partner site, Gold Eagle…
Donald Trump pulled off an upset victory Tuesday for the US Presidency, overcoming Hillary Clinton, who despite recent polls showed that the former Senator had a sizeable lead heading into the election. Yet by the end of the count, it was Trump who captured the required 270+ electoral college votes to win. And as most major world markets were pricing in an outcome in line with the polls, chaos erupted within the financial markets as votes began to show Trump securing a probable victory.
If there is one thing markets hate it is uncertainty. And as Trump will be the first US President without prior government experience to step into office, the outcome is certainly giving markets plenty to worry about.
By midnight of the election day, the US dollar had fallen 2.5% against a basket of world currencies, the Dow Jones Industrial Average was showing a loss of over 600 points for the morning open, and gold had spiked $65 to above $1,335. This was an impulsive fear reaction across the board.
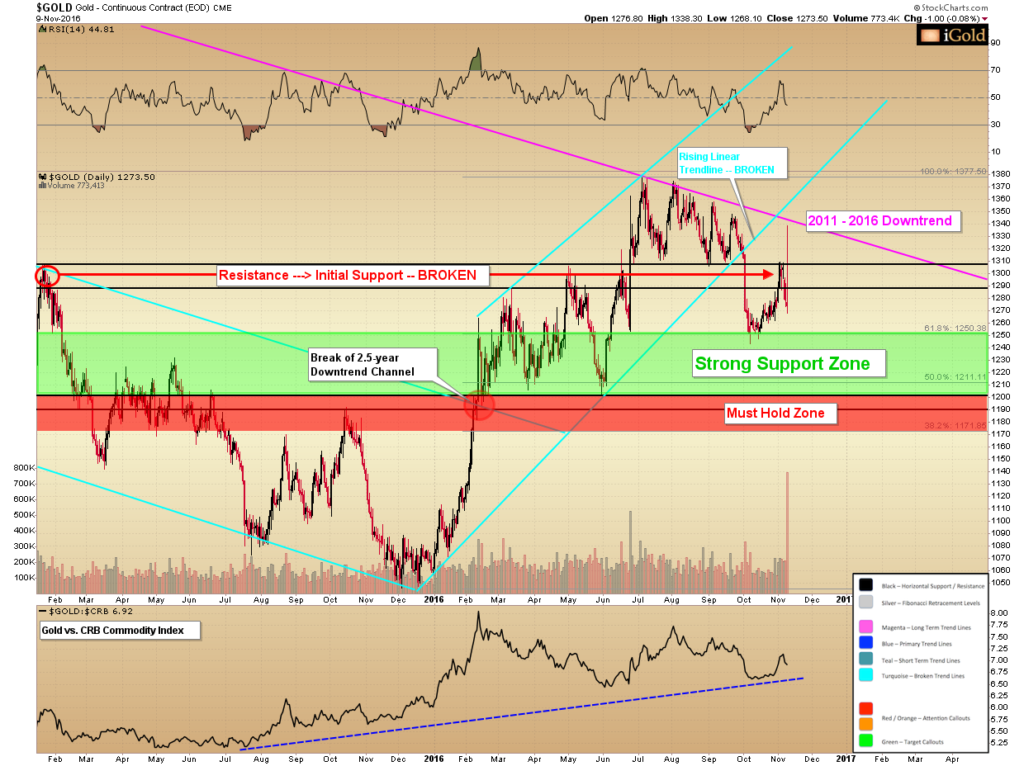
Yet by the end of the trading day, much of the initial fear had abated…with the dollar recouping its losses, the Dow Index finishing in positive territory, and gold giving back all of its gains.
This volatility is certainly extreme, but what is a precious metals investor to make of these wild gyrations? Was this a one-time blip for gold, or is there something more in the works?
Click here to continue reading the full article for FREE on our partner site, Gold Eagle…
Today we look at updates in the gold and silver price, as well as how the US Trump vs. Clinton election might impact the currency and precious metals markets.
Today we focus on the recent technical and sentiment indicators in the gold and silver mining complex. What should we look for to indicate a bottom is forming?