Interview with Don Harrold
https://www.youtube.com/watch?v=1CQRcJdo_dY

https://www.youtube.com/watch?v=1CQRcJdo_dY
The short-term forecast for gold is clear: the metal is set to move higher. Gold has just put in an intermediate low at $1,238 per ounce as of July 3, 2018. Several leading indicators point to an imminent recovery in prices over the next 1-3 months.
However, the longer-term picture for the precious metal is mixed: gold must overcome its 2016 high at $1,378 within the next six months to avoid a significantly bearish outcome that could result in a multi-year decline following such a failure.
The time to closely monitor gold’s price action for one of these scenarios is now.
Click here to continue reading for FREE on our partner site, Gold Eagle…
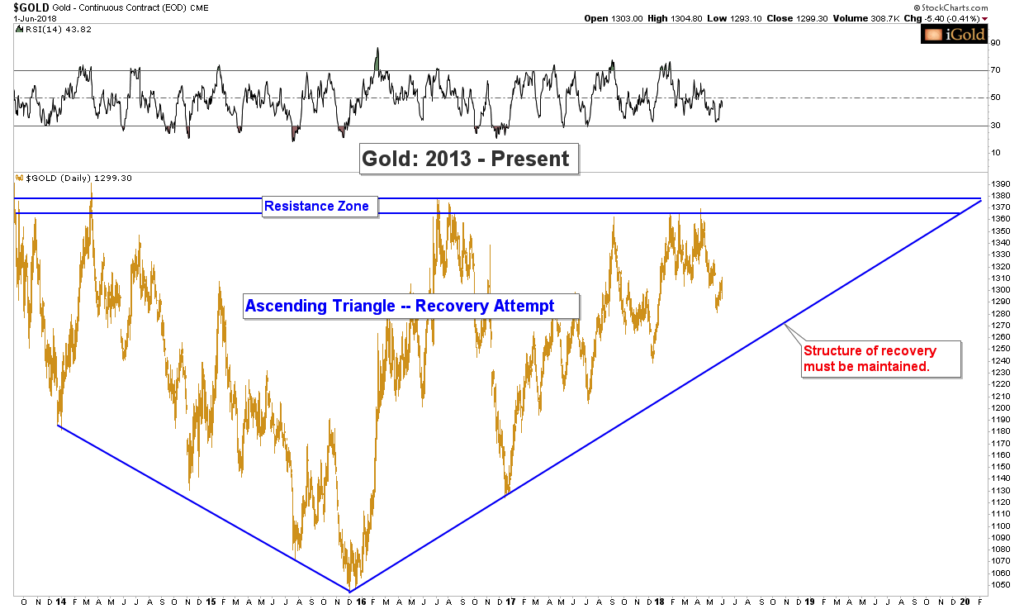
Gold is in a primary recovery pattern as it attempts to break above its 2016 peak of $1,378 per ounce. This recovery pattern appears over and over again throughout history – the success or failure of gold to maintain the structure of this pattern will pave the way for either a massive multi-year advance higher in the sector, or a grinding decline to last for the majority of the next decade.
We will have the answer to the question of which outcome to expect within the next 12-18 months.
It will behoove precious metals investors to pay close attention to the technical action and to tune out misleading rhetoric coming from both perma-bulls and perma-bears of gold and the precious metals sector.
Click here to continue reading for FREE on our partner site, Gold Eagle…
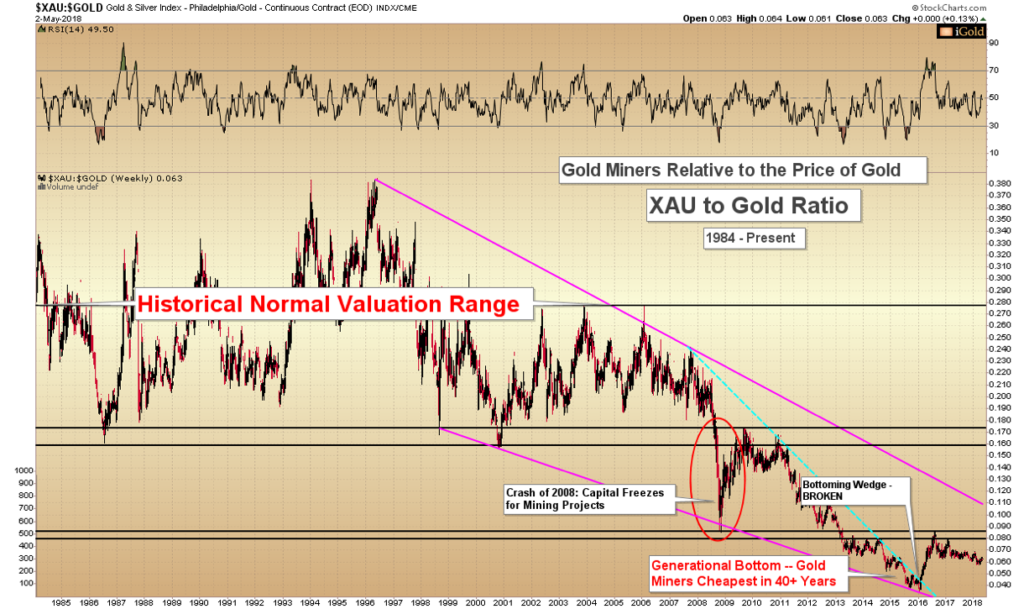
Gold miners, the companies which extract the element from the Earth which has served as the backbone of the global economic system since the dawn of civilization, remain historically undervalued across two key metrics that are used to value the sector. Opportunity for profit exists for those with patience for the sector to revert to the mean.
First, gold companies are undervalued versus the broader US economy: a ratio of gold mining versus the S&P500 index is at its lowest valuation of all time. Secondly and perhaps more interestingly, gold miners remain undervalued relative to the price of the actual metal they produce: gold itself.
As contrarians, these are statistics we should pay attention to. Let us examine the charts.
Click here to continue reading for FREE on our partner site, Gold Eagle…
Silver is acting weaker than it should be this juncture, just over two years after an important bottom in the precious metals complex formed in late 2015.
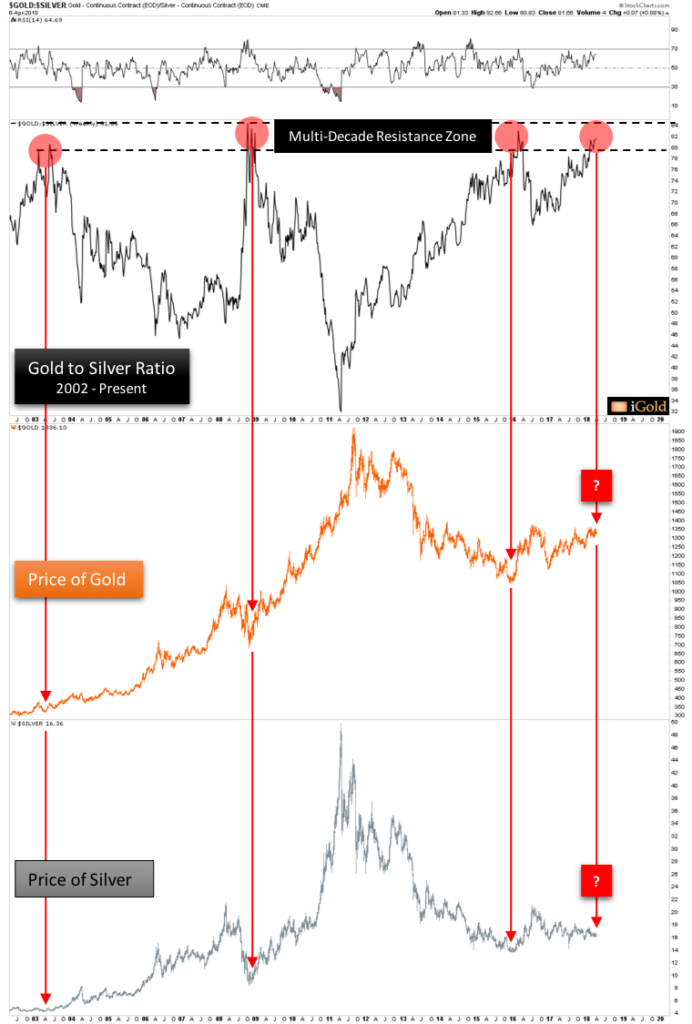
From the December 2015 lows in both precious metals at $13.65 per ounce for silver and $1,045 for gold, while both have risen, silver prices have underperformed gold. Since the bottom, silver is up 19.8% to close at $16.36 this week, while gold is up 27.8% to close at $1,336 over the same timeframe. Silver is clearly the laggard of the historic monetary metals amidst the present cycle.
What are we to make of this underperformance in silver? Is there still a possibility for silver to match gold’s performance? Or is this a warning sign that the advances in the precious metals since 2015 are suspect?
The best way to view the relationship between the two metals is through the gold to silver ratio. The ratio tells us how many ounces of silver are needed to purchase one ounce of gold. As of the end of the week, the ratio stood at 81.6.
Click here to continue reading for FREE on our partner site, Silver Phoenix…

Gold has been a part of the human story since the dawn of civilization. One part store of wealth, one part ornament, and one part modern technology, gold stands at the crossroads of multiple financial, religious, and industrial trends.
What actually drives gold prices? Is it fear of currency devaluation or stock market crashes? Is it war? Or is it jewelry and electronics fabrication?
The answer is many-fold. In this article, we will highlight the complex and inter-related drivers for gold prices worldwide so that investors may have a fuller understanding of the totality of the precious metals market.
Gold Supply and Demand
Fundamentally, the answer to what affects the price of gold is the same as for every other market: supply and demand.
Yet the supply and demand balance for gold, a market which dates back to the dawn of record-keeping itself, is itself largely driven by factors which are deeply ingrained in the human psyche.
Two extreme emotions – greed and fear – comprise the spectrum through which the majority of participants in the gold market make their buy and sell decisions.
In this article we will examine the many ways in which greed and fear play out, over and over again, in the most ancient of financial markets which is yet seeing new life today.
Gold Supply
Before we examine the actual numbers, let us consider one important preliminary supply factor for gold: this is the only element in which all of the supply ever mined in the history of the world still exists above ground. Gold never rusts, tarnishes, corrodes, or burns. Except for small amounts which may have been lost in shipwrecks at the bottom of the ocean or disposed of in landfills, all of the gold that has ever been brought to surface of the planet still exists in one form or another (and arguably, those two sub-components are retrievable as well).
Click here to continue reading for FREE on our partner site, Gold Eagle…

As President Trump prepares to nominate a new chair for the Federal Reserve this week, gold prices remain in a range bound consolidation. Not only has this grinding pattern been ongoing for the last several weeks, but when we examine the price chart for the last five years, we see that gold has essentially been flat as a net sum dating back to mid-2013. And indeed, to the mainstream investor who is primarily involved in a stock market now at all-time highs, gold appears of little interest at the present moment:

Yet we believe this is exactly the time when contrarian-minded individuals should be starting to pay attention to the precious metals. For underneath the surface, despite flat prices since 2013, gold is showing hints of strength to come.
In fact, there is a major leading indicator that is now flashing a buy signal. This signal has only registered once before in the past 17 years. And in the markets, the key is to act before something is widely recognized by the mainstream. Let us turn to this leading signal.
For the following discussion, we will refer to the chart below and the annotations (A) through (D):

The leading signal follows a series of three points, and the only other time that this signal has ever registered occurred at the major low for gold prices at $680 per ounce in October 2008, during the depths of the credit crisis (red arrow).
First, point (A), shown below the main chart: note how in October 2008, gold broke out versus the CRB commodity index at the major low. What this signal demonstrates is that even as gold prices were falling in the crash, they were falling at a much lesser rate than the rest of the commodity sector. Internally, this shows relative strength in favor of gold. In layman’s terms, it means that some investors were accumulating gold even as the rest of the commodities were being sold, and this signal hints that gold will lead once the rest of the commodity sector bottoms.
Next, point (B): in February 2009, gold broke through its declining (magenta color) trendline at $900 per ounce. This trend of lower prices began at the 2008 peak at $1,033 per ounce. Gold then rallied back to $1,000 within three weeks.
Next, at point (C): gold fell in April 2009 back down to $860. This decline resulted in a retest of the now-broken trendline, so labeled on the chart. A retest occurs as investors who bought during the initial price break are tested to see if they will show up again near the same level. Note that a retest of a broken trendlines can indeed occur at a lower price ($860) than the initial breakout point ($900). The most important facet is to recognize that the trend of lower peaks has broken.
Point (D): a multi-year rally to new highs commenced.
In sum, the leading signals (A) – (C) of gold rising versus the broad commodity index at a major price low, the downtrend break, and the trendline retest were all sequential indicators of a significant advance in prices setting up for the future. But those who waited for gold to advance well north of $1,000 per ounce had few opportunities for pullbacks over the next two years as prices more than tripled from 2008 crash lows.
The same set of signals are now registering for gold again, only on a greater timescale and with potentially greater ramifications.
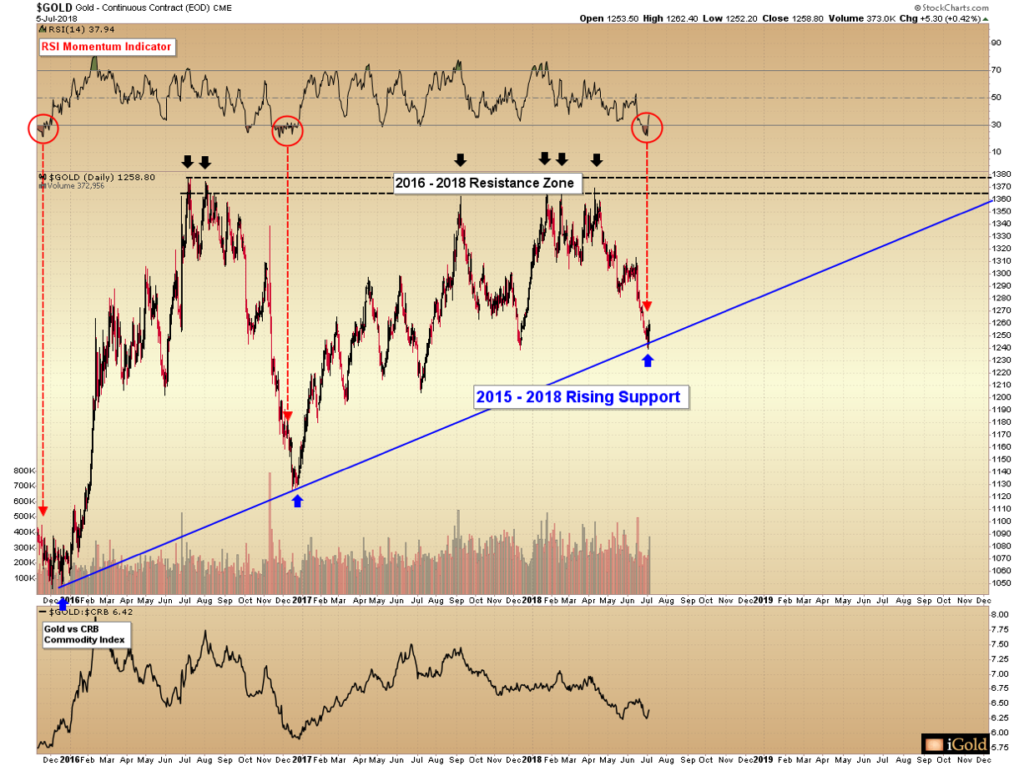
Note how (A) gold again broke out versus the CRB commodity index at a major price low ($1,045), in December 2015. This indicated gold accumulation was ongoing, even as most commodities were being discarded. This was the only other time that this signal has registered outside of the crash of 2008.
Next, at (B) gold broke its long-term 2011 – 2017 downtrend, at $1,265 in August 2017. Again, we see the pattern of lower peaks since 2011 being broken, the same signal which occurred in February 2009.
Presently, gold is (C) retesting that long-term downtrend break. Once again, in the same scenario as the initial example, this retest is occurring at a slightly lower price than the original downtrend break, as gold has recently fallen to $1,262 within the last two weeks. This is entirely acceptable within the technical model. The key is that the broken trendline should not fail, even if the retest occurs at a lower level.
After this retest occurs, our model indicates that a major rally will unfold. This will represent point (D) on the chart above. Our initial target for gold remains $1,485 – $1,535, but this is a first target only. It is quite possible that gold will advance well beyond that level in the years to come to perhaps challenge or exceed 2011 highs, but for the time present we are focused on initial targets only.
Imagine having sold gold at $860 in April 2009 out of frustration, on the retest of the broken trendline. This would have marked the last time gold ever traded below $900 before the major 2009 – 2011 advance carried prices higher by over $1,000 per ounce.
That same technical retest is occurring now in the gold market – it is just happening on a much longer timescale and at a higher initial price point.
We continue to believe that the present period will represent the final opportunity for those investors who are only focused on the nearly-flat prices since 2013 (as indicated on the first chart) to get washed out of this market in frustration.
Subtle strength is building underneath the gold market. A leading signal only seen one other time – the 2008 low at $680 per ounce – has again registered. The downtrend break has occurred. Gold is now retesting that downward trend.
This retest process could take several more months to play out, but the leading signals hinting for a major rally setting up in 2018 and beyond should not be overlooked.
Link to original article: http://news.gold-eagle.com/article/gold-price-forecast-%E2%80%93-first-breakout-signal-2008/816
It seems that hardly a week goes by that we do not hear that the US stock market has hit another new all-time high. And indeed, the US capital markets have been amongst the best performers in the world since the crash of 2008-2009 lows.
Many have wondered when the US and world stock markets might reach a peak for the implication this trend reversal would have on the gold market. While not always the case, in general a falling stock market would cause certain investors to seek safety, and gold would be a primary beneficiary.
As a backdrop, we already know that dividend yields (i.e. shareholders’ income) are at hundred-year low levels. Dividend yields move inversely to price, so by this measure it appears that stock prices are largely overvalued.

For example, assuming companies could maintain dividend payments throughout a crash (however unlikely), it would take over a 60% crash in stock market prices to bring yields on the S&P 500 back to the 4.5% mean which held from the late 1800’s through 1990.
Further, yields are still below where they were during the peak of the 1929 bubble (labeled Black Tuesday)!
Yet we can also see that since 1995, investors have seemingly forgotten about yield altogether, as dividends have remained at 100+ year low levels for this entire period. Thus, we cannot use dividend yields alone as a predictor for the next stock market turndown, no matter how much lower than historic norms these payouts are.
We instead must turn to other forms of analysis.
There are specific technical characteristics of past market peaks that we can observe from history and apply to today. Let us look at a few examples.
First let us examine the period surrounding the great crash of 1929. Below is the chart of the Dow Jones Industrial Average from 1900 through 1943:

Here we can gain key insight into the phases a market progresses through as it approaches an unsustainable bubble and the technical characteristics that define each stage.
We can see the same set technical characteristics when we study the NASDAQ / dot-com bubble of the 1990’s here in the United States:

Again, note the five stages that the market progressed through en route from an healthy rising market à to a disorderly advance à to a parabolic bubble à followed by a crash à followed by a return to some sense of order again.
These are key characteristics that we should look for in stock markets which are approaching speculative bubble peaks.
We must remember that not all markets must feature parabolic blow-offs in their final stages. The other form that long-term tops may take is a rolling-over and breaking of the orderly rising channel to the downside, prior to a sustained decline.
An example of this setup was the bull market leading up to the Crash of 2008, shown below:

Here we see the same orderly linear rising channel to begin the bull market (blue channel).
However, in contrast to the two examples above, in 2007 we witnessed no disorderly rise leading to any sort of parabolic curve higher.
Instead, the S&P 500 simply began to roll over, eventually breaking down through the lower boundary of the rising channel in late 2007.
This was followed by a failed retest of the channel in mid-2008, and then the historic crash in the fall of that year.
The common theme in identifying a long-term top in stock market cycles from a technical basis is an orderly rising market that becomes disorderly.
The direction that the multi-year channel breaks – either higher or lower – generally tells us whether that market is going to:
Again, within the backdrop that stock prices as measured by dividend yields are generally overvalued, let us examine the chart since the Crash of 2008-2009 lows:

Again, what we see is an orderly linear rising channel. Yes, this channel is quite steep – but we see no signs yet of the market becoming disorderly either higher or lower.
Note that there were two false breakdown signals (2011 and 2016) during which it appeared the market was set to roll over, similar to 2007. However, after the brief panic, buyers stepped back in, and the rising channel was resumed.
The point is that we have no evidence from a technical basis for an impending stock market top at present.
Could a top form within the next several years? Absolutely – yes.
Do we desire to chase the stock market higher at this point, when dividend yields are at generationally-low levels? Absolutely – not.
Yet again, from identifying the footprints of past market cycles, we can say that one of two things must happen to signal an impending decline in the stock market:

We may have a fundamental belief regarding the over-valuation of the US stock market – however, the market shows no imminent signs of forming a top, and markets can stay irrational for many years longer than fundamentals might warrant.
When topping signs do manifest they will be clear on the charts.
We remind readers that precious metals do not always move counter-cyclically to stock prices, i.e. in a highly inflationary environment, both can rise at the same time. For example, since the January 2016 lows, despite the broad stock market receiving all the media attention, the precious metals sector has significantly outpaced the S&P500.
Link to article on Gold-Eagle: http://news.gold-eagle.com/article/us-stock-market-%E2%80%93-signs-top/646