Silver in a Stock Market Crash — How Does It Perform?

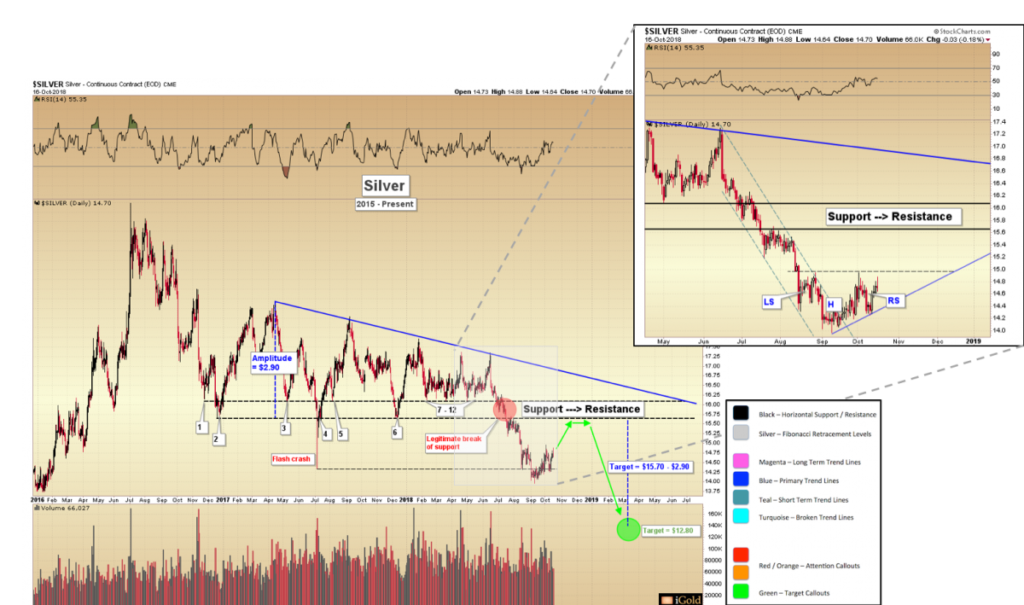
Silver has enjoyed a modest recovery over the past six weeks, rising from a low of $14.00 in September to $14.70 as this article is being written. What is in store for this dual precious and industrial metal as 2018 closes out? Is there more upside to come or will the downward trend of lower prices from last summer re-exert itself?
Over the next several weeks, we see higher prices in store for silver. However, once this rally concludes, another down-leg should begin for gold’s cousin. Investors should monitor these trends closely as they develop and be prepared for a better buying opportunity early next year.
Let us turn to the visible data.
Click HERE to continue reading the article for free on our partner site, Silver Phoenix…
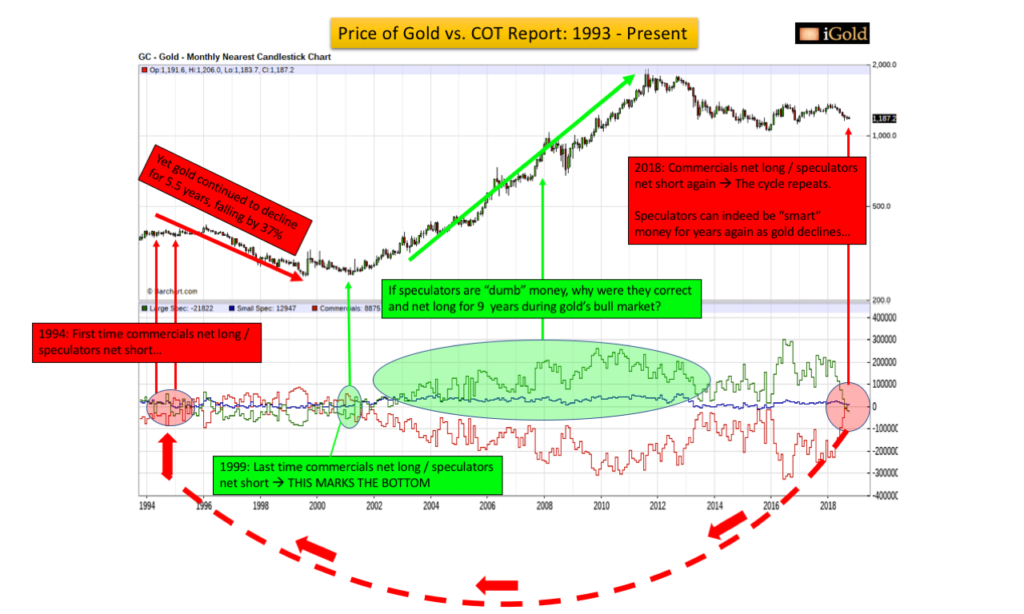
There is a fallacy now spreading throughout the precious metals world, and gold investors who believe it to be true will be making a costly mistake when attempting to navigate the volatility in this market over the next several years.
What is the fallacy we are referring to?
Gold’s Commitment of Traders (COT) Report, and the claim of the bullish setup that is being purported on account of the net long position by commercial traders and net short position by large speculators.
Indeed, not a week goes by that we do not see articles published claiming that this myth is in fact true. We will not name any names here in this article, because the fallacy is nearly universally believed, and a quick Google search for “Gold COT report” will reveal dozens of such misleading articles. The time has come to set the record straight.
Click HERE to continue reading the article for free on our partner site, Gold Eagle…
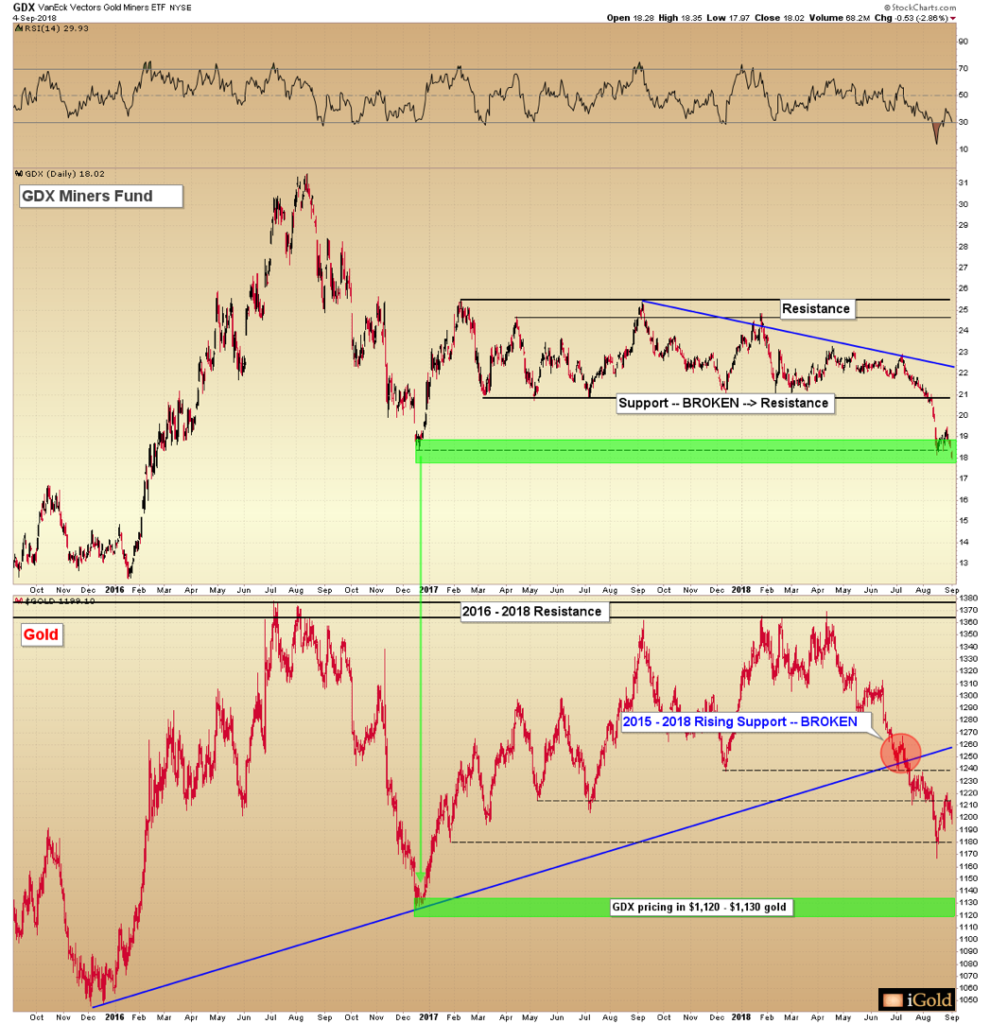
Gold has had a rough several months. The precious metal is down some $170 from its peak in April near $1,370, closing today just below $1,200 on the New York COMEX futures market. As we indicated in our last article, gold has failed to maintain the structure that would be indicative of a bull market in progress. That said, no market moves in a straight line, and a reversal will be in store at some point. What are some price projections as gold heads lower over the coming months where we may look to see support emerge?
There are a number of ways to estimate price targets for gold. Established support and resistance zones, Fibonacci retracements, and trend channels are just a few. However, for this article let us focus on a powerful way to gauge the potential for future gold prices – and that is: what the mining complex is expecting.
Gold mining profits are leveraged to the underlying metal price. When the price of gold rises by 1%, gold miner profits typically rise by 2% – 3%, as the underlying costs to mine the metal remain relatively fixed. The same leverage works to the downside of course. The bottom line is that investors in the gold mining sector should have a solid idea of what the price of gold itself is going to do, as the price is a critical determinant of operational success.
That said, let us examine the figures that the gold miners are now pricing in for their own product. This can be a valuable form of analysis to use any time one is preparing to make a sizeable gold purchase.
Below we show the GDX large-cap gold miners fund on top, with the price of gold immediately below it. The GDX contains an average of approximately 50 different mining operations. Let us examine the relative valuations of the two since late-2015:
Click here to continue reading for FREE on our partner site, Gold Eagle…
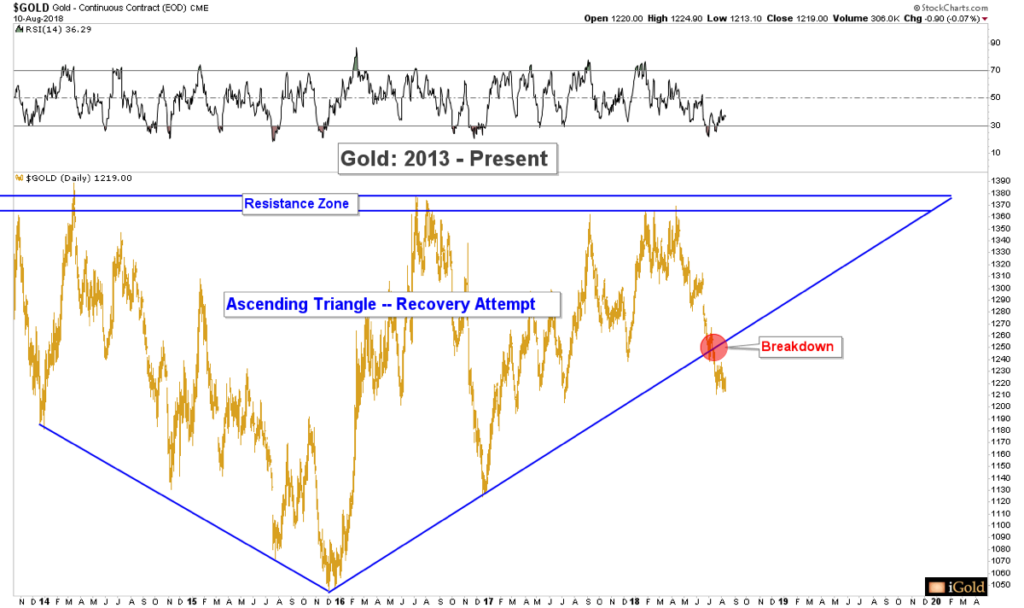
Gold’s bottoming attempt following the 2015 low of $1,045 per ounce has failed to maintain a price structure indicative of a rising trend. Consequently, the odds have now shifted significantly that precious metals will not be in a bull market for the foreseeable future. This does not mean that the price of gold is going to crash, nor that an investment in the precious metals sector may not be wise given one’s unique situation. However, with the recent trend failure the highest-probability is that the 2016 peak of $1,378 per ounce will not be overcome for gold for at least the next several years.
Let us examine the current price trajectory and some ramifications.
Click here to continue reading for FREE on our partner site, Gold Eagle…