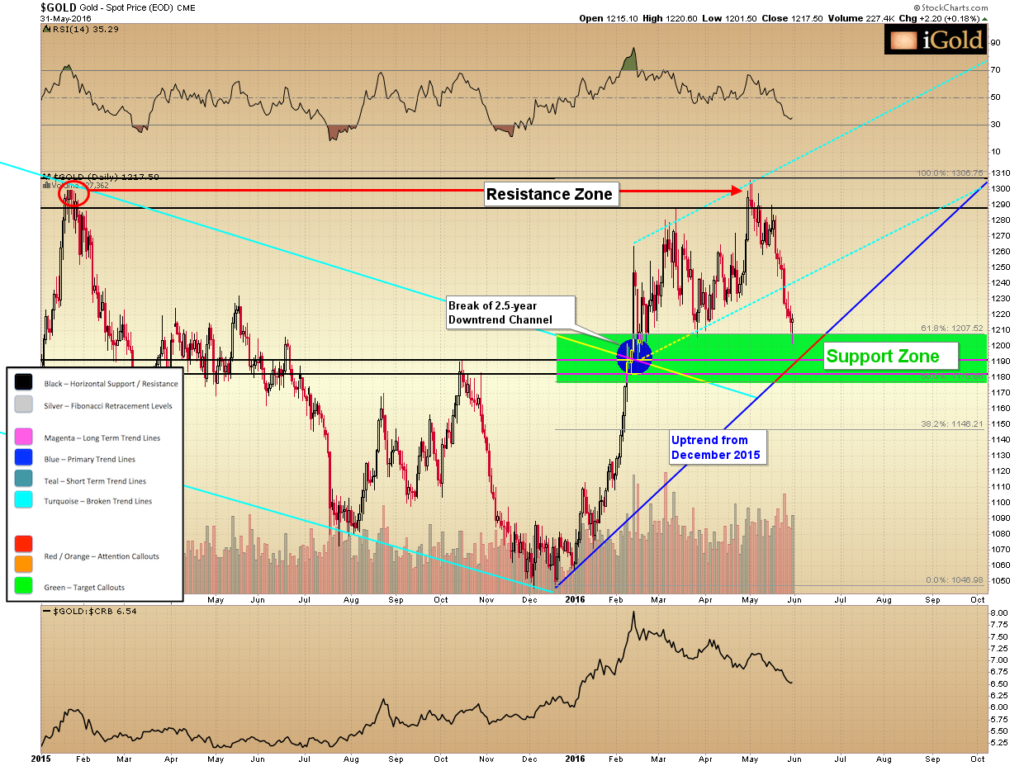
Gold has now fallen for four weeks in a row and has come back into an important technical support zone. This is the lower range of the anticipated trajectory we have been outlining for some months. We expect prices to now begin to carve out a bottom, though this process may take some weeks to play out. Consequently, the final low may not be in place yet.
Last Friday, gold closed down $37 or some 3% from a week prior to finish at $1,215 per troy ounce.
The technical action warrants a thorough discussion, and for that we refer to the following 18-month chart of spot gold:
First, note that gold has now fallen $105 from it’s recent $1,306 high. This is an 8% decline. It is fascinating to watch the shift in investor psychology with such a modest correction, as we observe a lot of fear in the precious metals sector at this time.
Of course, as investors in not only the physical metals but also the precious metals mining sector, we can see how such relatively small moves in the metals can translate into tremendous swings in the valuations of these companies. In gold’s 22% move higher in gold from December through April, we saw 100-200% gains across many gold mining companies; and now, with the 8% drop lower in gold prices, we have seen 20-40% corrections across these same equities.
What type of gains will the mining sector see at $1,400…$1,500…$1,900 gold?
But, let’s get back to the current price of spot gold. The price has broken through our short-term upward sloping trend lines, which are now shown above in turquoise for reference. This short-term technical breakdown means that gold will need to consolidate for some time before it is ready to advance through the $1,305 region that now serves as resistance.
Continue reading the full article for free on our partner site Gold Eagle…

