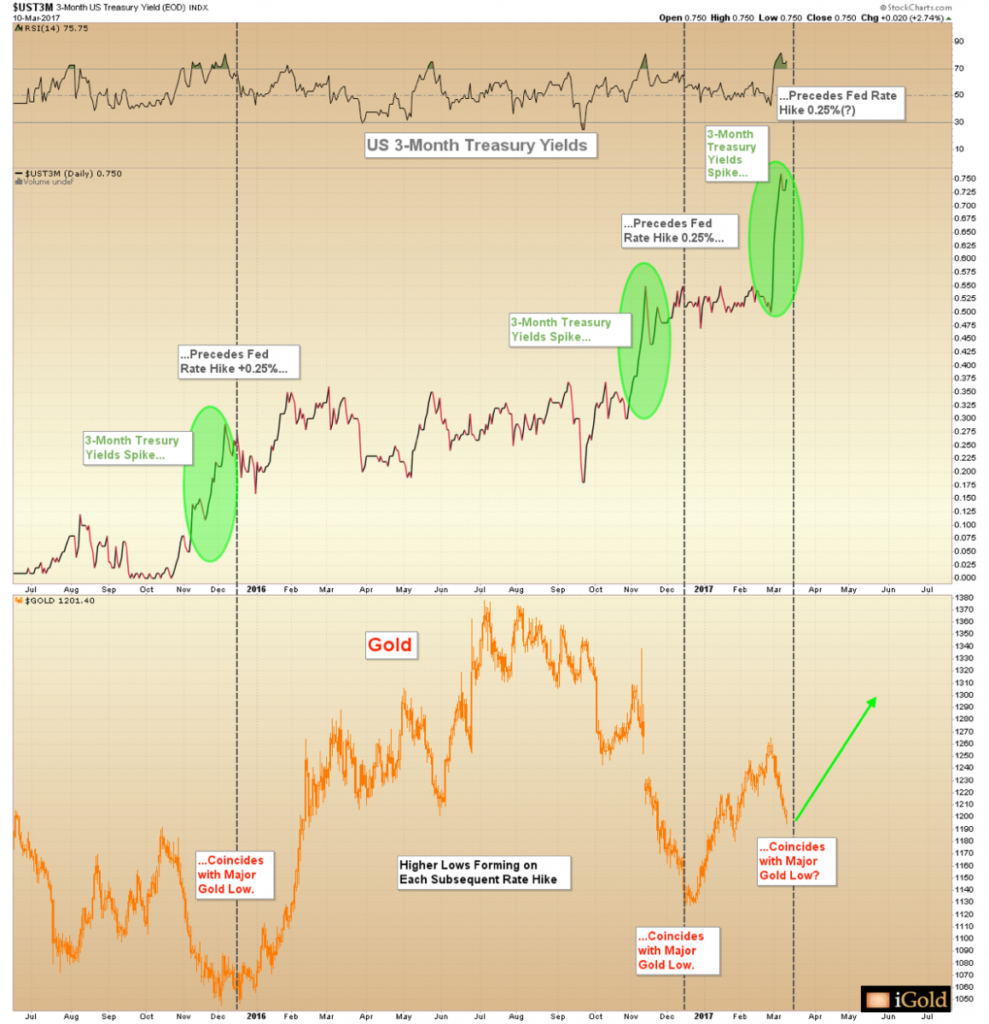
Three-month US Treasury Bills are now pricing in a hike for tomorrow’s interest rate decision by the US central bank. This leading indicator has been highly accurate since the first Federal Reserve Rate hike in December 2015. Below we show a two-part graph, with the 3-month Treasury yield on top, and the price of gold immediately below. Fed ¼ point rate hikes are highlighted by the black vertical lines:
Click here to continue reading the full article for FREE on our partner site, Gold Eagle…

