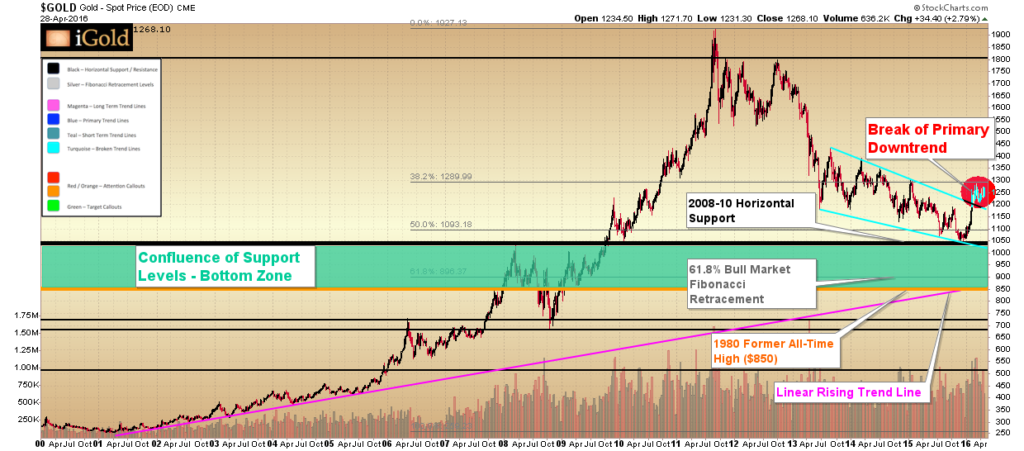
Gold is up nearly 21% from its December 2015 lows. Moreover, silver has added an impressive 28% to its price during the same timeframe. Most notably, the HUI gold and silver mining index is up over 100% during this period.
Despite the strong performance we have seen from the precious metals complex thus far in only the first few months of 2016, many fear that the move is already nearing an end. Readers should be aware that the potential for both gold, silver, and strong mining equities is much greater than the moves seen thus far. Indeed, a review of the metals and several valuation metrics over a longer time frame can provide us with clues as to what we should expect through the later part of this decade.
Below we review the long-term perspective for gold since the year 2000. Gold bottomed in 2001 after a nearly 20-year bear market following the peak in 1980 at $850/oz. The return advance to again challenge the $850 level took eight years, although it was not until the following year (2009) that prices decisively broke through this level for good.
Gold then advanced for two years above the former all-time high, hitting $1,917/oz in 2011, before falling back some 45% over the course of nearly five years through the end of 2015.
Markets that consolidate for 29 years (1980 – 2009) below an important peak level ($850) do not finish their subsequent advances in only two years. What was seen from 2009-2011 was simply the initial surge higher from the multi-decade 1980 – 2009 consolidation. The retreat since 2011 is thus a correction within what will be a more significant move higher both in time and in price above the former 1980 peak.
Continue reading the full article for free on our partner site Gold Eagle…

