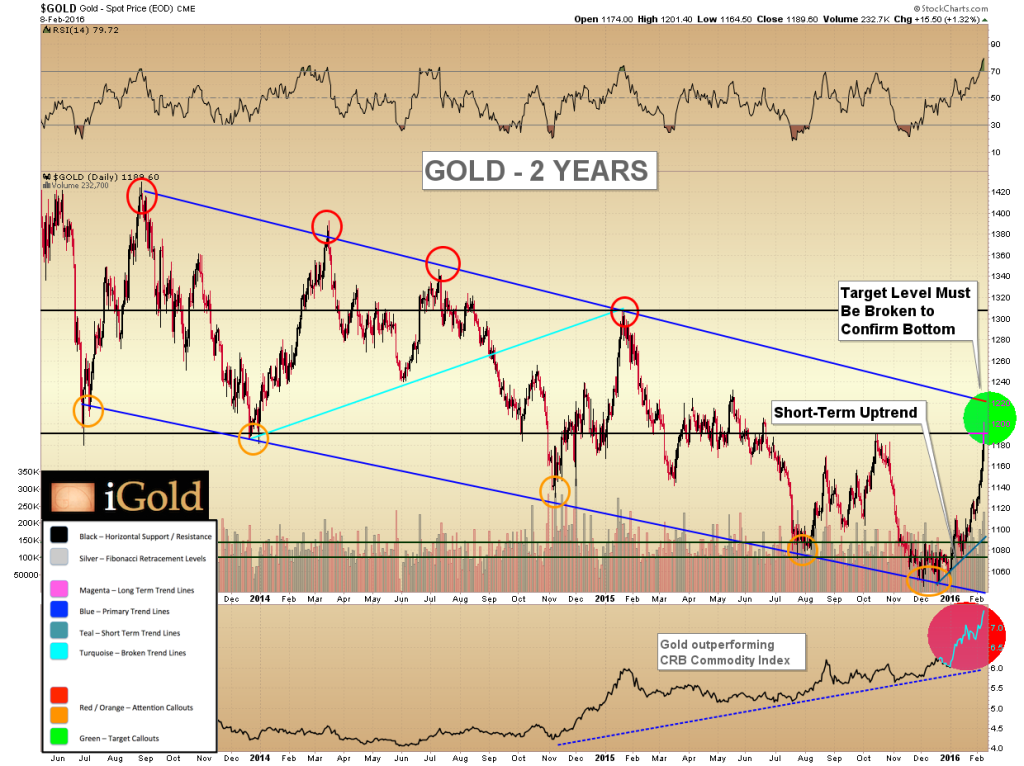
The precious metals are at critical junctures that will mark the final lows for the bear market since 2011. The surge in gold during the New Year has been impressive, with prices rising from $1,045 per ounce to hit $1,200 as this article goes to press, a gain of 15%. Has the final low been put into place?
Gold’s Key Resistance Level
We back our charts out to a 15-year timeframe to view the current action in proper context. Below we can see the rise in gold from 2001 through the peak in 2011, followed by the current bear market. Since early 2013, the downward moves have been defined primarily by a clear series of waves contained within a linear downtrend channel as shown in blue.
Continue reading the full article for free on our partner site Gold Eagle…
